
Monthly Market Memorandum - April 2026

Contents
Executive Summary
Macro & Market Overview
2.1 Inflation & Rates
2.2 Global Economic Activity
2.3 Equity Markets
2.4 Fixed Income & Credit
2.5 Commodities & Alternatives
Key Themes of the Month
3.1 The Iran Shock
3.2 The Ceasefire Trade
3.3 Japan’s Breakout
What to Watch Next Month
Closing Remarks
Executive Summary
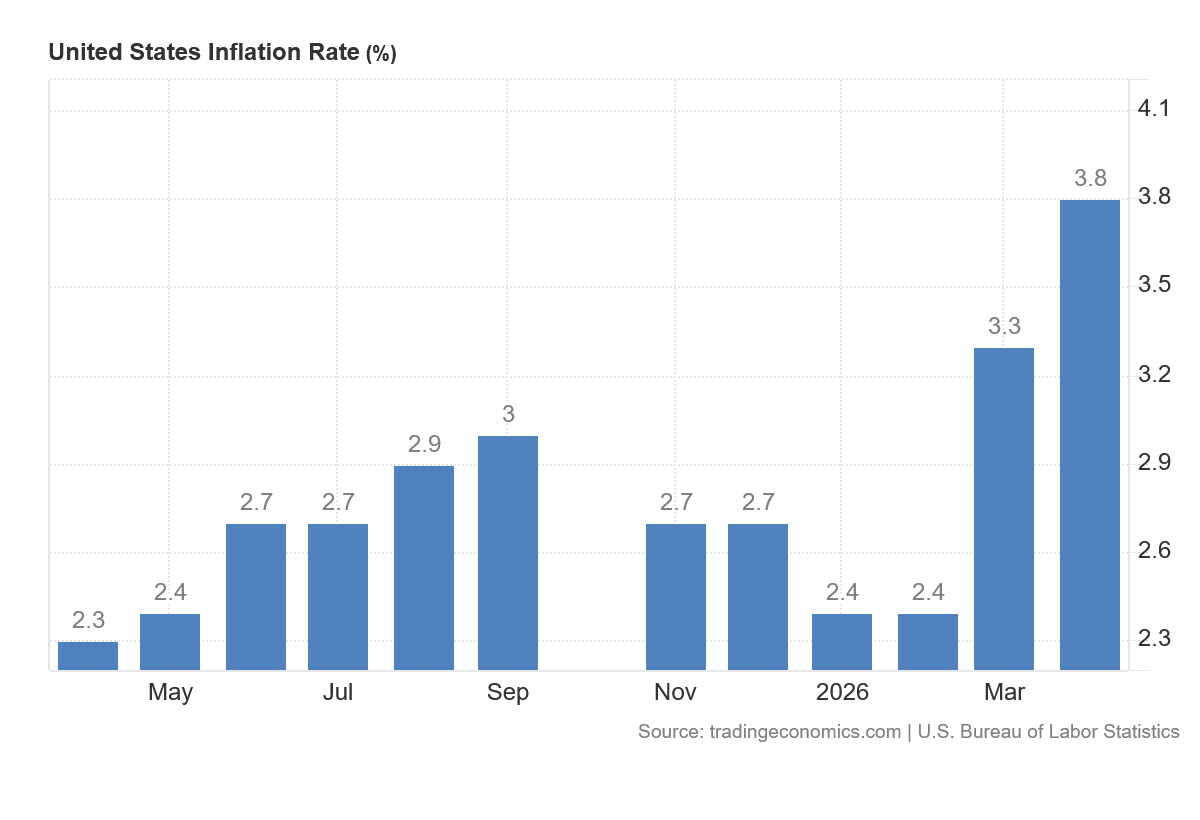
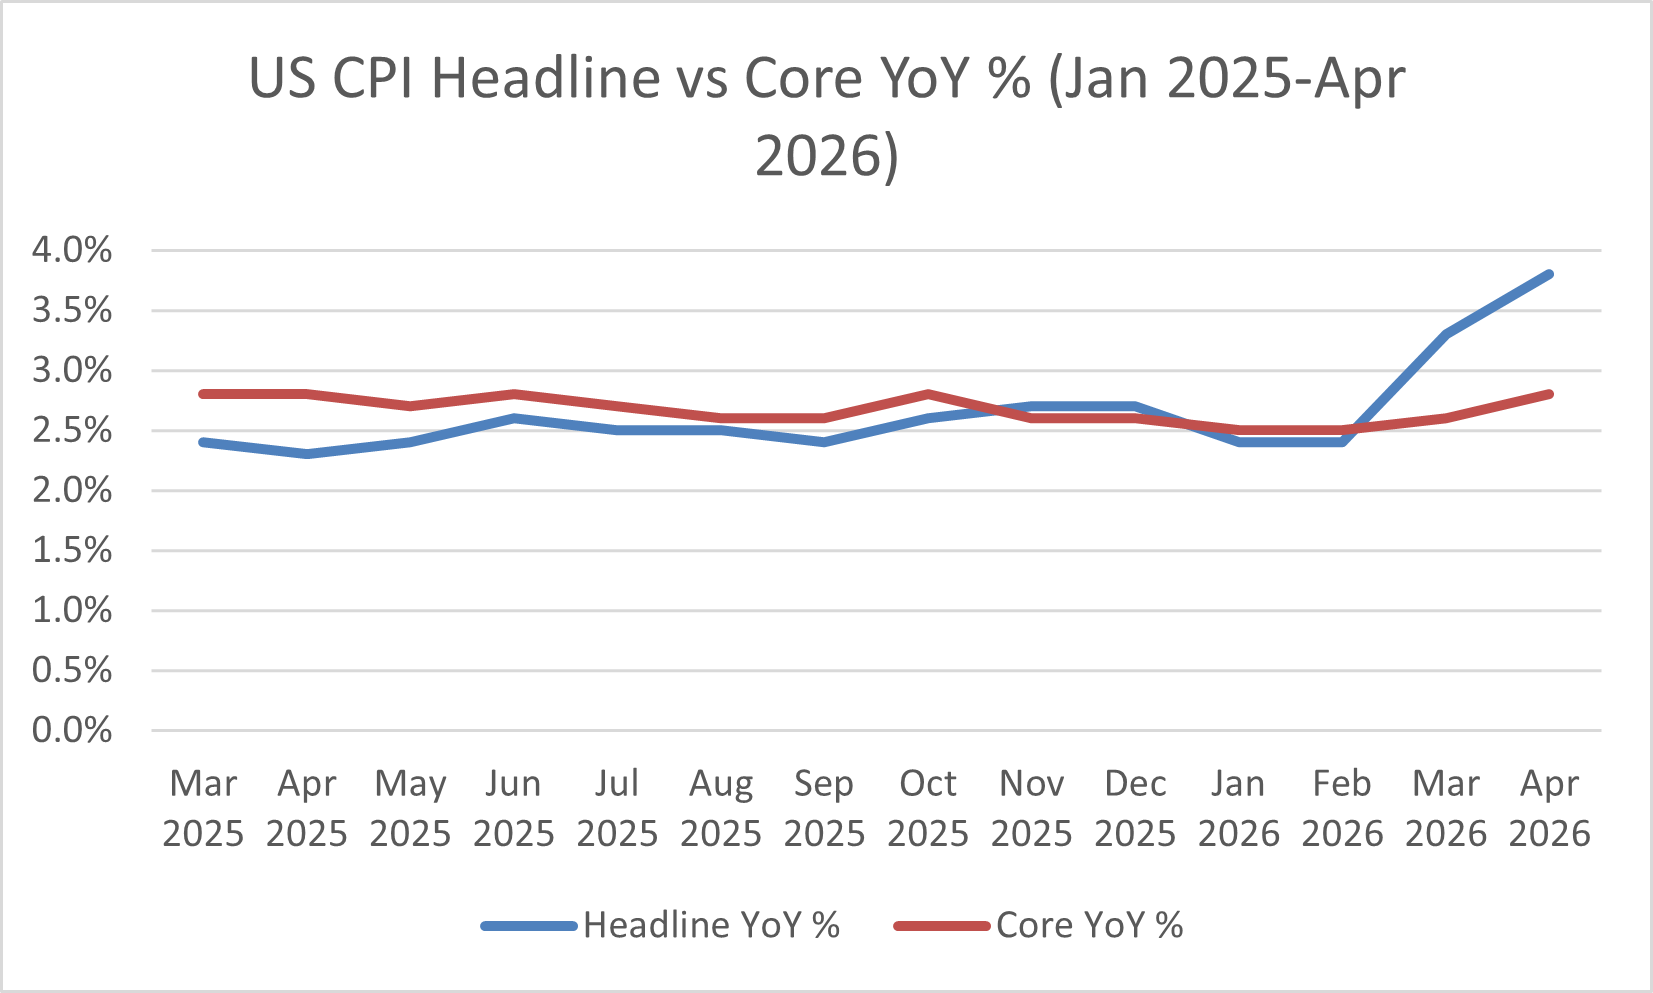
April 2026 was defined by one dominant variable: the US-Israel war against Iran, which began at the end of February, closed the Strait of Hormuz, and generated the largest oil supply shock in the history of global petroleum markets. The shock cascaded across every asset class covered in this memorandum. Crude oil peaked near $126 per barrel intraday at month end, gasoline prices surpassed $4.50 per gallon nationally for the first time since 2022, and US headline CPI for March surged to 3.3% year-over-year from 2.4% the prior month. The April CPI release confirmed the inflation re-acceleration was not transitory, printing at 3.8% headline and 2.8% core.
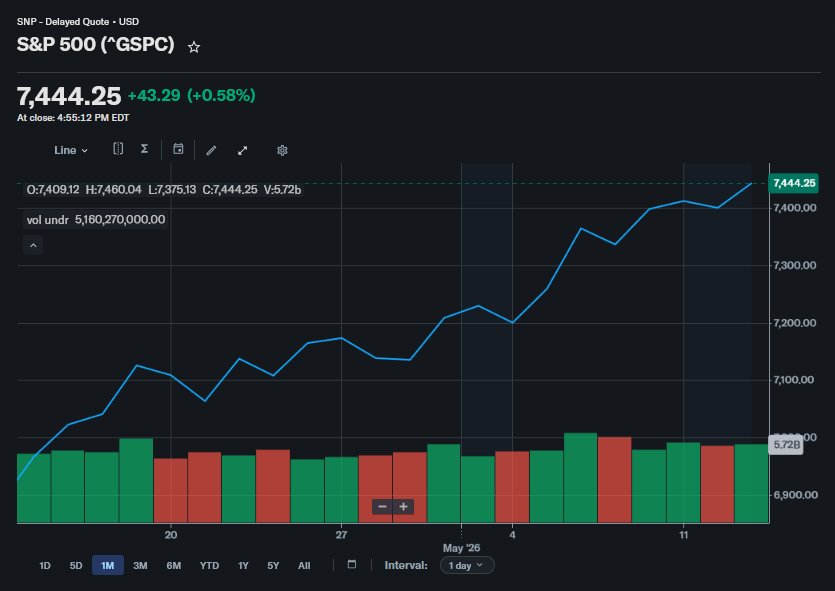
Despite this stagflationary backdrop, equity markets delivered their strongest monthly performance in years. The S&P 500 gained approximately 10.4% in April, its best month since November 2020, and both the S&P 500 and Nasdaq reached new all-time highs. This apparent paradox was driven by two converging forces: a mid-month US-Iran ceasefire that allowed oil prices to partially retrace, triggering a historic rotation back into risk assets, and a strong corporate earnings season that exceeded expectations and reinforced confidence in near-term earnings visibility. The Nasdaq staged a twelve-consecutive-day winning streak into month end, its longest since 2021.
Outside the United States, the performance picture was highly differentiated. Japan's Nikkei 225 broke through 60,000 for the first time in its history, powered by strong manufacturing data, yen weakness, and a hawkish-hold from the Bank of Japan affirming the reflation narrative. Asia broadly outperformed, with South Korea posting exceptional gains on semiconductor and AI related rerating, and Hong Kong and mainland China rallying on renewed policy easing expectations. Europe was the notable underperformer: the Eurozone Composite PMI contracted for the first time in nearly eighteen months, the ECB held rates at 2.0% while explicitly warning that hike risk had increased, and energy-intensive German industry bore a disproportionate burden from the supply disruption.
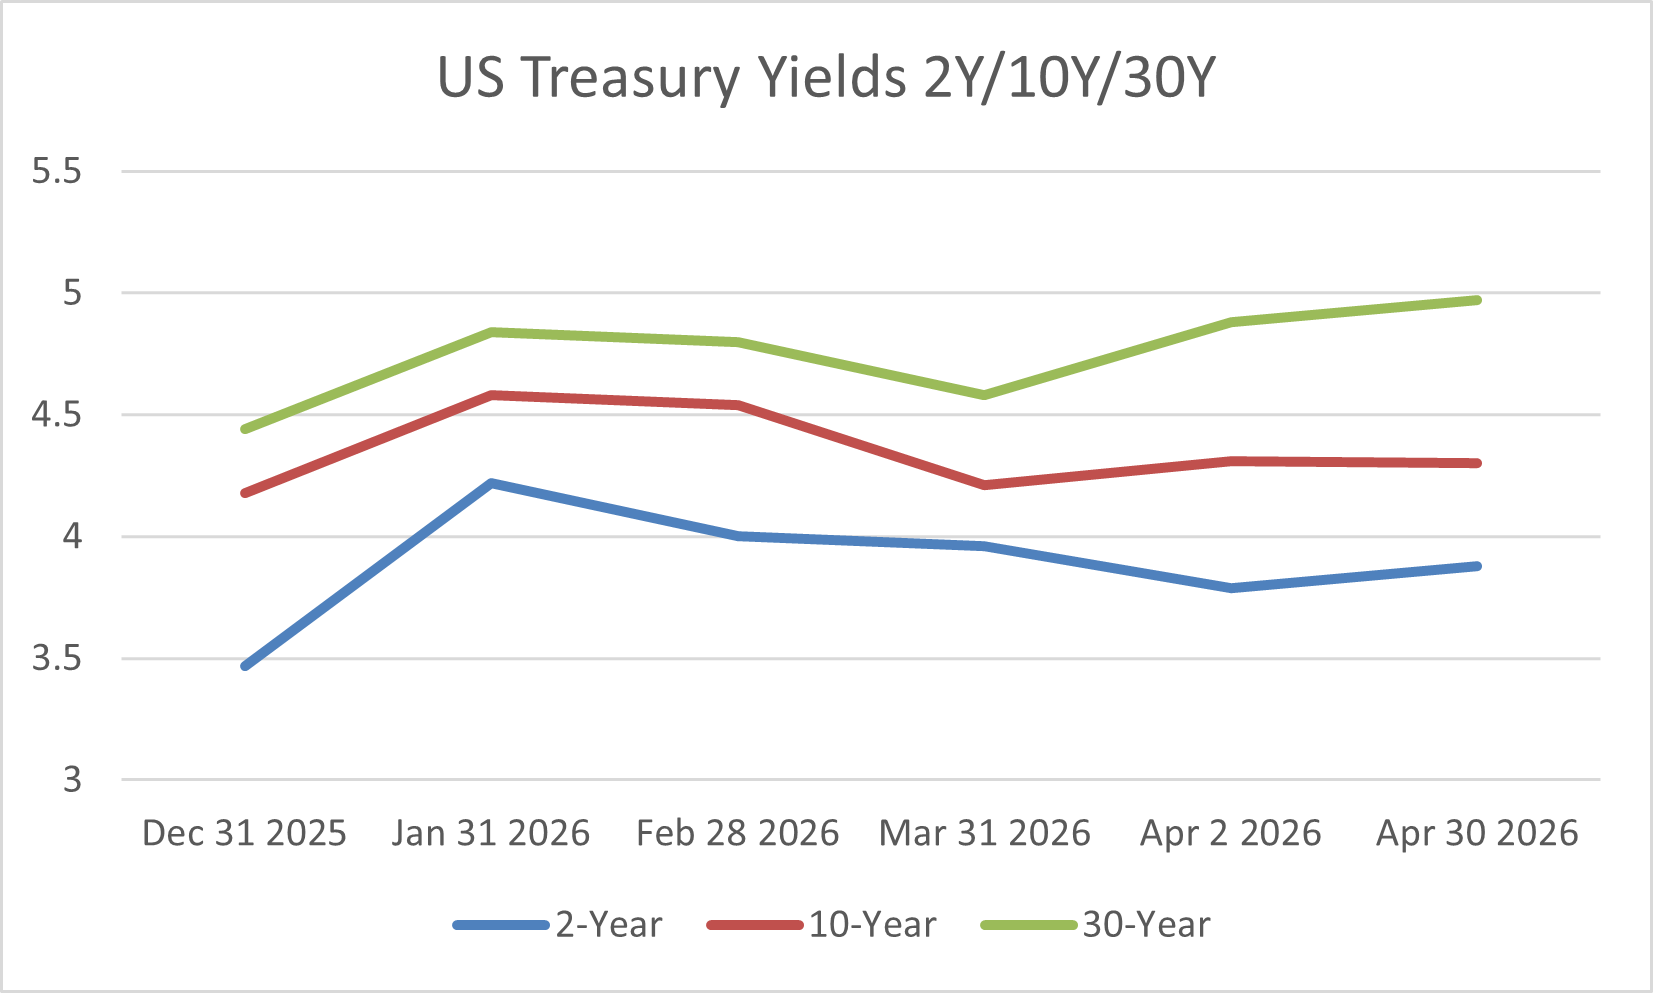
In fixed income, US Treasury yields began April elevated, with the 10-year at 4.31% and the 30year at 4.88%. As ceasefire negotiations progressed, yields pulled back modestly, with the 10year ending the month at approximately 4.30% and the 2-year at 3.88%, maintaining a positively sloped yield curve of approximately 42 basis points. The Federal Reserve held the federal funds rate at 3.50%-3.75% for the third consecutive meeting, and market pricing for rate cuts in 2026 collapsed to near zero. German Bund yields closed at 3.03%, UK Gilt yields climbed to 5.01%, and JGB yields rose nearly 17 basis points to 2.52%.
Credit markets remained surprisingly resilient. US investment grade option-adjusted spreads held near 80 basis points and high yield spreads stayed near 285 basis points, well below the stress levels seen in previous geopolitical crises. This reflected strong corporate balance sheets and the ceasefire narrative that limited left-tail risks. Gold ended April approximately flat at $4,611 per ounce, as the return of risk appetite weighed against safe-haven demand, though structural ETF inflows led by European investors provided underlying support.
Three themes prevail. First, the persistence of higher-for-longer yields remains the dominant constraint on asset pricing globally, and April reinforced that even oil-driven headline inflation can re-anchor upside rate expectations in a structurally sticky environment. Second, US equity markets reasserted dominance with narrow, tech-driven leadership, demonstrating the market's preference for earnings visibility over macro safety. Third, credit resilience in the face of slowing global growth has been the market's most consistent surprise, but the widening dispersion within high yield and European credits deserves close monitoring.
Macro & Market Overview
Inflation & Rates
The US-Israel war against Iran transformed the global inflation outlook in April, ending the disinflation trend that had characterized most of 2025 and early 2026, and raising the spectre of a renewed higher-for-longer rate environment across every major developed economy. What had been a cautiously optimistic picture in February, with US headline CPI at 2.4% year-over-year and the ECB deposit rate at 2.0%, gave way to a coordinated inflation re-acceleration that central banks were structurally unable to address through conventional rate tools alone. The energy channel was the primary transmission mechanism, but as April data revealed, price pressures were beginning to broaden into services and core categories.
United States
US inflation for March 2026, released in April, recorded headline CPI at 3.3% year-over-year, the highest reading since May 2024, and up sharply from 2.4% in both January and February. The monthly gain of 0.9% was the largest since June 2022. Energy accounted for the dominant share of the increase, with the energy index rising 10.9% for the month, led by a 21.2% surge in gasoline prices that accounted for nearly three-quarters of the total monthly CPI increase. National average gasoline prices climbed above $4.00 per gallon for the first time in over three years, driving the headline print well above the Federal Reserve's 2% target.
Core CPI told a more measured story in March. Core CPI rose 2.6% year-over-year, slightly below consensus expectations of 2.7%, and the monthly gain of 0.2% remained contained. Services inflation excluding energy rose 0.2% for the month and 3.0% annually. Shelter was up 3.0% yearover-year, tied for its lowest pace since August 2021, suggesting that structural core inflation dynamics remained relatively anchored even as energy dominated the headline.
The April 2026 CPI release confirmed that this containment was short-lived. Headline CPI accelerated further to 3.8% year-over-year in April, the highest since May 2023, driven by energy costs jumping 17.9% annually, with gasoline up 28.4% year-over-year. Critically, core CPI ticked up to 2.8% year-over-year, the highest since September 2025, and the monthly core gain of 0.4% was the sharpest since January 2025. Apparel prices rose 4.2%, transportation services climbed 4.3%, and shelter continued at 3.3% annually. The broadening of inflation beyond energy into discretionary categories represented a deterioration in the underlying inflation dynamic and materially complicated the Fed's policy calculus. Real average hourly wages fell 0.5% for the month and declined 0.3% annually for the first time in three years, delivering a direct financial squeeze on middle-income households.
Eurozone HICP by Component -- Energy, Core, Food YoY % - Mar-Apr 2026
The Federal Reserve held the federal funds rate at 3.50%-3.75% at both its March and April meetings. The April meeting produced four dissenting votes, the highest since 1992, with three regional Federal Reserve presidents objecting to language perceived as tilting toward a future cut, and one governor voting for an immediate 25 basis point reduction. Fed funds futures pricing showed zero probability of a 2026 rate cut by month end. Bank of America extended its first expected cut to the second half of 2027, while JPMorgan projected headline CPI to remain above 3.0% into early 2027. At the same time, incoming Fed Chair Kevin Warsh's public advocacy for lower rates was rendered untenable by the April inflation data.
Eurozone
The Eurozone experienced a sharp and sudden break in its inflation trajectory as the Iran war filtered through energy import prices. Euro area HICP inflation rose to 2.6% in March 2026, up from 1.9% in February, the highest reading since July 2024 and the first breach above the ECB's 2% target after months of convergence. The March reading reflected energy costs swinging sharply into positive territory, rising 4.9% year-over-year, the sharpest increase since February 2023. Services inflation moderated slightly to 3.2% from 3.4%, and core HICP eased to 2.3% from 2.4%, providing some comfort that underlying price dynamics had not yet deteriorated significantly.
April's flash estimate confirmed further acceleration. Eurozone HICP inflation climbed to 3.0% in April, the highest since September 2023, slightly above market expectations of 2.9%. Energy costs surged 10.9%, the most since February 2023. Non-energy industrial goods inflation picked up to 0.8% from 0.5%, while food, alcohol and tobacco rose 2.5%. Services inflation eased to 3.0% from 3.2%, and the core rate fell modestly to 2.2% from 2.3%. The combination of faster headline but contained core suggested that the primary transmission channel remained the direct energy price shock, but the ECB's Survey of Professional Forecasters revised 2026 HICP expectations sharply upward to 2.7%, reflecting the market's growing concern about the conflict's duration.
Across the bloc's largest economies, the pattern was consistent but uneven. Germany saw inflation accelerate to 2.9% in April, the highest since January 2024. Italy recorded 2.9% yearover-year, Spain reached 3.5%, and France remained somewhat more contained at 2.5%, reflecting proportionally lower energy intensity. The ECB held its deposit facility rate at 2.0% at the April 30 meeting, a unanimous decision accompanied by a notably hawkish shift in communication. President Lagarde stated the ECB was 'certainly moving away' from its baseline scenario. Market pricing assigned over 78% probability to a 25 basis point hike at the June meeting by month end. The ECB's position, with inflation above target and growth deteriorating, bore meaningful similarities to the post-Ukraine energy shock of 2022.
Japan
Japan's core CPI (all items less fresh food) was 1.8% year-over-year in March, up from 1.6% in February, reversing the early-2026 deceleration, though still below the Bank of Japan's 2% target. The headline figure was 1.5%, reflecting energy subsidies that continued to suppress electricity and gas prices despite the global crude surge. Analysts noted that if crude oil prices remained elevated and no further subsidy expansions were implemented, core inflation could rise toward 3% by the end of fiscal year 2026.
The Bank of Japan held its short-term policy rate at 0.75% at the April 27-28 meeting, passing by a split 6-3 vote. The three dissenting governors voted for an immediate increase to 1.0%, arguing that Middle East energy pressures had skewed inflation risks to the upside. The BOJ's quarterly Outlook Report raised the FY2026 core CPI forecast sharply to 2.8% from 1.9%, projecting that elevated crude oil prices would push up energy and goods costs. GDP growth for FY2026 was cut to 0.5% from 1.0%, illustrating the stagflationary trade-off the BOJ faced. The JGB 10-year yield rose nearly 17 basis points in April to end at approximately 2.52%, just below a three-year high. The yen weakened over 1.5% year-to-date to the 159 handle, prompting Finance Minister Katayama to pledge decisive action.
United Kingdom
UK CPI reached 3.1% year-over-year in March 2026, with services inflation, the Bank of England's preferred measure of domestic stickiness, remaining elevated above 4%, reflecting tight labor market conditions and ongoing wage growth. The Bank of England held its bank rate unchanged at 4.50% at the April meeting, acknowledging inflationary pressures from the Middle East while monitoring the growth outlook. UK Gilt 10-year yields climbed 9 basis points in April to end at 5.01%. The S&P Global Flash UK Composite PMI recorded one of the largest monthly increases in output prices in the history of the survey, signaling a challenging combination of slowing activity and accelerating input costs.
Canada and Australia
Canada's CPI was last available at 2.6% year-over-year in February 2026, with March data not released as of this memo's cutoff. The Bank of Canada held its overnight rate at 2.75% through April, navigating between residual energy-driven inflation and softer domestic demand. Given Canada's significant energy production, the oil shock had a mixed domestic effect: higher energy revenues for producers but cost pressure on consumers and energy-intensive manufacturers exposed to global commodity chains disrupted by the Strait of Hormuz closure. Australia's CPI of 2.4% year-over-year in the February quarter remained near target, and the Reserve Bank of Australia held at 4.10%. The Australian economy benefited from commodity price strength, partially offsetting higher energy import costs.
-
US Headline CPI (CPIAUCSL)
https://fred.stlouisfed.org/series/CPIAUCSL
US Core CPI (CPILFESL)
https://fred.stlouisfed.org/series/CPILFESL
US 2 Year Treasury Yield (DGS2)
https://fred.stlouisfed.org/series/DGS2
US 5 Year Treasury Yield (DGS5)
https://fred.stlouisfed.org/series/DGS5
US 10 Year Treasury Yield (DGS10)
https://fred.stlouisfed.org/series/DGS10
Federal Funds Target Rate
https://fred.stlouisfed.org/series/DFEDTARU
Federal Reserve Policy Statements
https://www.federalreserve.gov/monetarypolicy/fomccalendars.htm
European Central Bank Key Interest Rates
https://www.ecb.europa.eu/stats/policy_and_exchange_rates/key_ecb_interest_rates/html/index.en.html
Bank of Japan Policy Rates
https://www.boj.or.jp/en/statistics/boj/other/discount/index.htm
Global Economic Activity
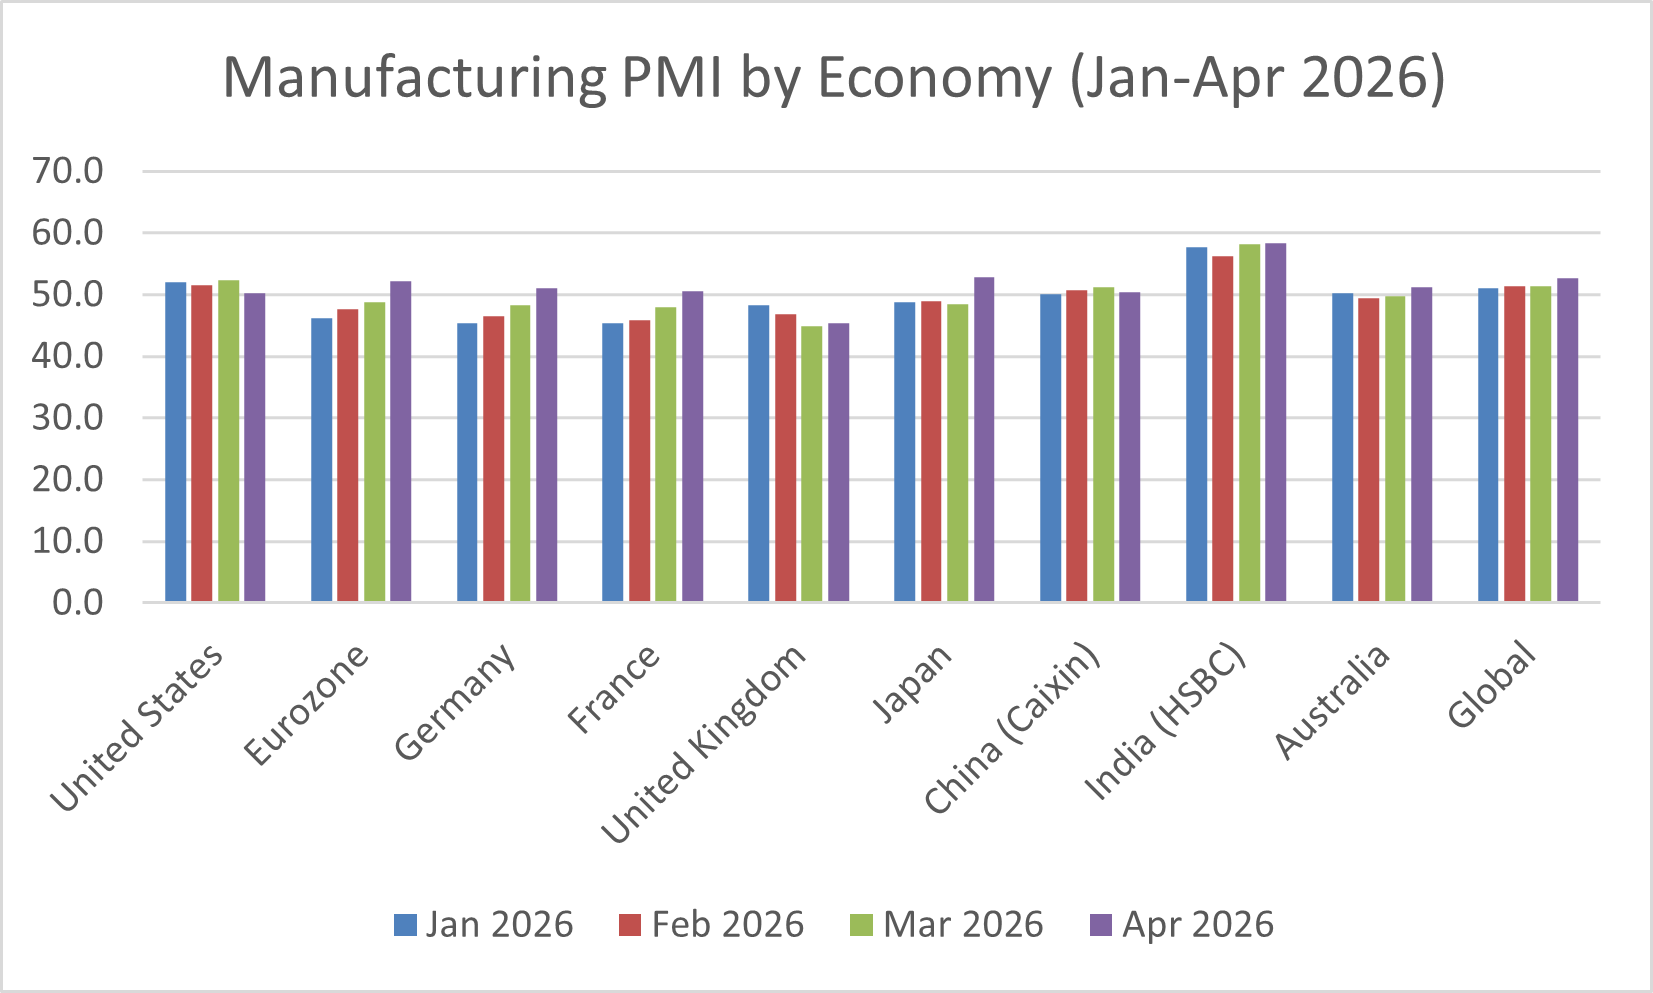
Global economic activity in April 2026 presented a bifurcated picture more pronounced than any month in the prior twelve: a world in which manufacturing was re-accelerating in several economies due to war-related stockpiling and supply disruption, while services were contracting in regions most exposed to the cost-of-living shock and travel disruption generated by the Iran conflict. The standard PMI divergence between manufacturing and services inverted in several key economies, introducing an unusual form of growth complexity that frustrated conventional leading indicator frameworks.
United States
US manufacturing activity maintained its expansion trajectory through April, though at a somewhat moderated pace. The S&P Global US Manufacturing PMI printed 50.2 in April, down from 52.3 in March, reflecting the winding down of aggressive pre-conflict stockpiling seen in March and initial demand softness from higher energy costs. The March reading had been supported by firms frontloading safety stock and securing supply ahead of potential escalation, the eighth consecutive month above 50. April's moderation was therefore partially expected as inventory builds were absorbed.
The more significant signal came from services, where the S&P Global US Services PMI indicated that new business intakes fell for the first time in two years, with the survey noting that the war in the Middle East and elevated inflation were hitting demand. Travel, tourism, and financial services were the weakest performing sub-sectors. The US Composite PMI for April remained in expansion at 52.0, a two-month high, as manufacturing partially offset services softness, but the directional trend in services was a warning sign for consumer-led growth.
Labor market data remained a stabilizing force. Private payroll growth surged in Q1 2026 to over 2.5 times the 2025 monthly average, and the unemployment rate held near cyclical lows. Real average hourly wages, however, turned negative in March and April as nominal wage growth of approximately 3.5%-4.0% annually was overwhelmed by the 0.9% monthly CPI print in March. This wage-inflation squeeze represented the first sustained decline in real household purchasing power in three years. Consumer sentiment reached all-time lows in April despite equity markets at record highs, illustrating the disconnect between financial asset performance and household economic experience.
Japan
Japan delivered the most positive economic surprise of the month among major developed economies. The S&P Global Japan Manufacturing PMI reached 52.8 in April, its highest since February 2014, driven by war-related supply chain hedging, yen weakness boosting export competitiveness, and genuine underlying demand strength from Japan's domestic recovery. Manufacturing output expanded at the quickest rate in over twelve years, a historic reading that contributed to the Nikkei 225 breaking through 60,000 for the first time in history. Services activity slowed modestly to 52.3 but remained in expansion. The Composite PMI at 52.1 indicated continued overall expansion. Japan's labor market remained tight, with the job-to-applicant ratio above 1.0, and wage negotiations through the spring Shunto cycle showed nominal gains in the 3%-4% range supportive of the BOJ's reflation thesis.
China
China's economic activity in April showed notable acceleration, with the Caixin Composite PMI rising to 53.1, a two-month high. Manufacturing remained resilient at 50.4 and services rebounded to 52.3, reflecting domestic policy support, pre-emptive inventory building by exporters, and improving domestic consumption demand. The acceleration followed March's sharp PMI decline. China's position in the Iran war was economically ambiguous: as a major importer of Iranian oil, China was directly exposed to the Strait of Hormuz closure. Goldman Sachs estimated that exports through the chokepoint had fallen to just 4% of normal volumes. China required a rapid shift toward alternative suppliers at higher spot prices, contributing to higher domestic energy and manufacturing input costs.
The property sector, the key structural drag on Chinese growth, showed early signs of stabilization relative to 2025 lows. New home prices in major cities continued to decline on an annual basis but at a moderated pace. Fixed asset investment remained constrained, but infrastructure investment, supported by government spending programs, partially compensated. The government's incremental policy support measures were insufficient to trigger a broad property recovery but were preventing further systemic deterioration.
India
India delivered the standout emerging market economic performance of April. The HSBC India Manufacturing PMI rose to 58.3, a multi-month high and one of the strongest global readings, reflecting robust domestic demand, strong export order growth, and India's structural beneficiary position from global supply chain diversification. Services activity remained elevated, and the Composite PMI signaled continued strong overall expansion. India's inflation remained contained relative to peers, and the Reserve Bank of India maintained its cautious stance. Indian equities rose approximately 5%, demonstrating resilience relative to the Eurozone.
Australia and Other Oceania
Australia returned to manufacturing expansion in April after a brief March dip. As a major exporter of coal, iron ore, and LNG, Australia benefited from higher commodity prices even as it faced higher fuel import costs domestically. The terms-of-trade impact was broadly positive. The RBA held its cash rate at 4.10%, and growth expectations for 2026 remained around 2.0%-2.5%, among the most stable in the developed world.
-
United States ISM Manufacturing PMI
https://www.ismworld.org/supply-management-news-and-reports/reports/ism-report-on-business/
Trading Economics – United States Manufacturing PMI
https://tradingeconomics.com/united-states/manufacturing-pmi
Trading Economics – Euro Area Manufacturing PMI
https://tradingeconomics.com/euro-area/manufacturing-pmi
Trading Economics – China Manufacturing PMI
https://tradingeconomics.com/china/manufacturing-pmi
Trading Economics – Japan Manufacturing PMI
https://tradingeconomics.com/japan/manufacturing-pmi
S&P Global PMI Releases
https://www.pmi.spglobal.com/Public/Home/PressRelease
National Bureau of Statistics of China
Equity Markets
April 2026 will be remembered as one of the most remarkable monthly equity recoveries in modern market history. A month that began in the shadow of a historic energy shock, collapsing consumer confidence, and multi-year highs in inflation concluded with the S&P 500 at an all-time high, the Nasdaq recording its longest winning streak since 2021, and equity markets globally delivering gains that defied the macro backdrop. Understanding this outcome requires disaggregating the month into two distinct phases, separated by the mid-April ceasefire between the United States and Iran.
United States
April began with US equities under pressure from the March CPI reading of 3.3%, released April 10, and the continuation of the Strait of Hormuz blockade. The S&P 500 opened April near 6,550, with the Nasdaq remaining well below its January all-time highs. The mid-April inflection point arrived when President Trump confirmed diplomatic contact with Lebanese and Israeli officials, and an initial ceasefire was announced. Equity markets responded with extraordinary force. The S&P 500 crossed 7,000 for the first time on April 15, gaining approximately 3.3% for the week and the Nasdaq advancing 5.2%. The Nasdaq logged its tenth consecutive positive session by April 15, and the streak extended to twelve days, the longest since 2009. Falling oil prices reduced input cost fears, improved real consumer income expectations, and triggered mechanical flows into high-duration growth assets.
By month end, the S&P 500 closed at approximately 7,230, a gain of roughly 10.4%, its best monthly performance since November 2020. The Nasdaq Composite finished near 24,103. The breadth of the move, however, was narrow. Approximately two-thirds of S&P 500 stocks remained below their highs on the strongest day of the rally, with market capitalization concentration in mega-cap technology driving the headline return. Apple crossed $300 per share for the first time in history, Nvidia and the VanEck Semiconductor ETF delivered outsized AI-driven gains, and a strong Q1 earnings season provided the fundamental anchor for valuation expansion. The Dow Jones Industrial Average gained approximately 9.9% as financials and consumer discretionary faced sector-specific headwinds.
Technology and communication services led the month on the AI earnings narrative and the return of risk appetite. Energy stocks fell alongside oil's partial retreat from its $126 intraday peak. Consumer staples lagged as higher food prices raised cost questions for margin-thin retailers. Financial services faced mixed signals from net interest margin benefits offset by credit quality concerns. The result was a market in which the headline index performance significantly overstated the breadth of equity gains.
US Equity Performance
The S&P 500 declined approximately 5.8% in March, with losses concentrated in the second half of the month as Brent crude breached 100 dollars per barrel. The Nasdaq Composite fell 5.4%, while the Russell 2000 declined 7.2%, consistent with small-cap underperformance in environments where financing costs and consumer spending uncertainty rise simultaneously and where smaller companies have less balance sheet flexibility to absorb input cost shocks. The month began with constructive momentum. As of the start of March, the S&P 500 Equal Weight Index was sitting at all-time highs and market breadth had been improving. By mid-March, all eleven S&P 500 sectors were in negative territory for the month.
Technology performed better relative to the broader market than many observers expected given its traditional sensitivity to rising interest rates. This reflected a structural shift in how investors are treating large-cap AI-linked companies. The earnings bases of the largest AI infrastructure and platform names are now large enough, and their balance sheets strong enough, that they are increasingly regarded as defensive earnings assets rather than pure-duration rate-sensitive growth plays. The continued concentration of S&P 500 market cap in a handful of mega-cap technology companies provided partial protection to the cap-weighted index even as the median constituent experienced more severe declines.
S&P 500 forward earnings estimates of approximately 305 dollars per share for 2026 were already being revised lower in March as analysts applied energy cost haircuts to margin assumptions in transportation, airlines, consumer discretionary, and the broader industrials complex. The Shiller CAPE ratio, which entered 2026 above 40 for only the second time in its 155-year history, stood near 38.93 in March, still more than double the long-term historical average of approximately 17. The pace and depth of earnings revisions will be a primary driver of equity market direction through Q2.
International Equity Markets
European equities showed genuine resilience in the early days of March, benefiting from structural improvements in the fiscal outlook, ECB prior easing, and growing defense sector momentum. The STOXX Europe 600 finished down approximately 4.1% for the month, somewhat better than US benchmarks. European defense and aerospace names provided consistent partial support as Middle Eastern escalation renewed attention on NATO spending commitments. Metals and mining companies outperformed in the final week following reports of Iranian strikes on aluminum facilities in Bahrain and the UAE, which caused aluminum prices to surge sharply.
Japanese equities fell approximately 6.3% as measured by the Nikkei 225. The yen's modest depreciation in the early weeks of the conflict partially cushioned USD-denominated returns but did not offset the underlying headwind from Japan's acute energy import cost exposure. Chinese equities showed notable resilience, with the Shanghai Composite declining only 2.9% for the month. This reflected the Chinese government's rapid deployment of strategic petroleum reserve releases, which dampened the immediate corporate earnings impact, and the fact that China's equity market had already been underperforming global peers through much of 2025, meaning less speculative positioning to unwind. The MSCI EM index declined 4.8%, with commodity-exporting nations partially offsetting oil-importing economies.
Europe
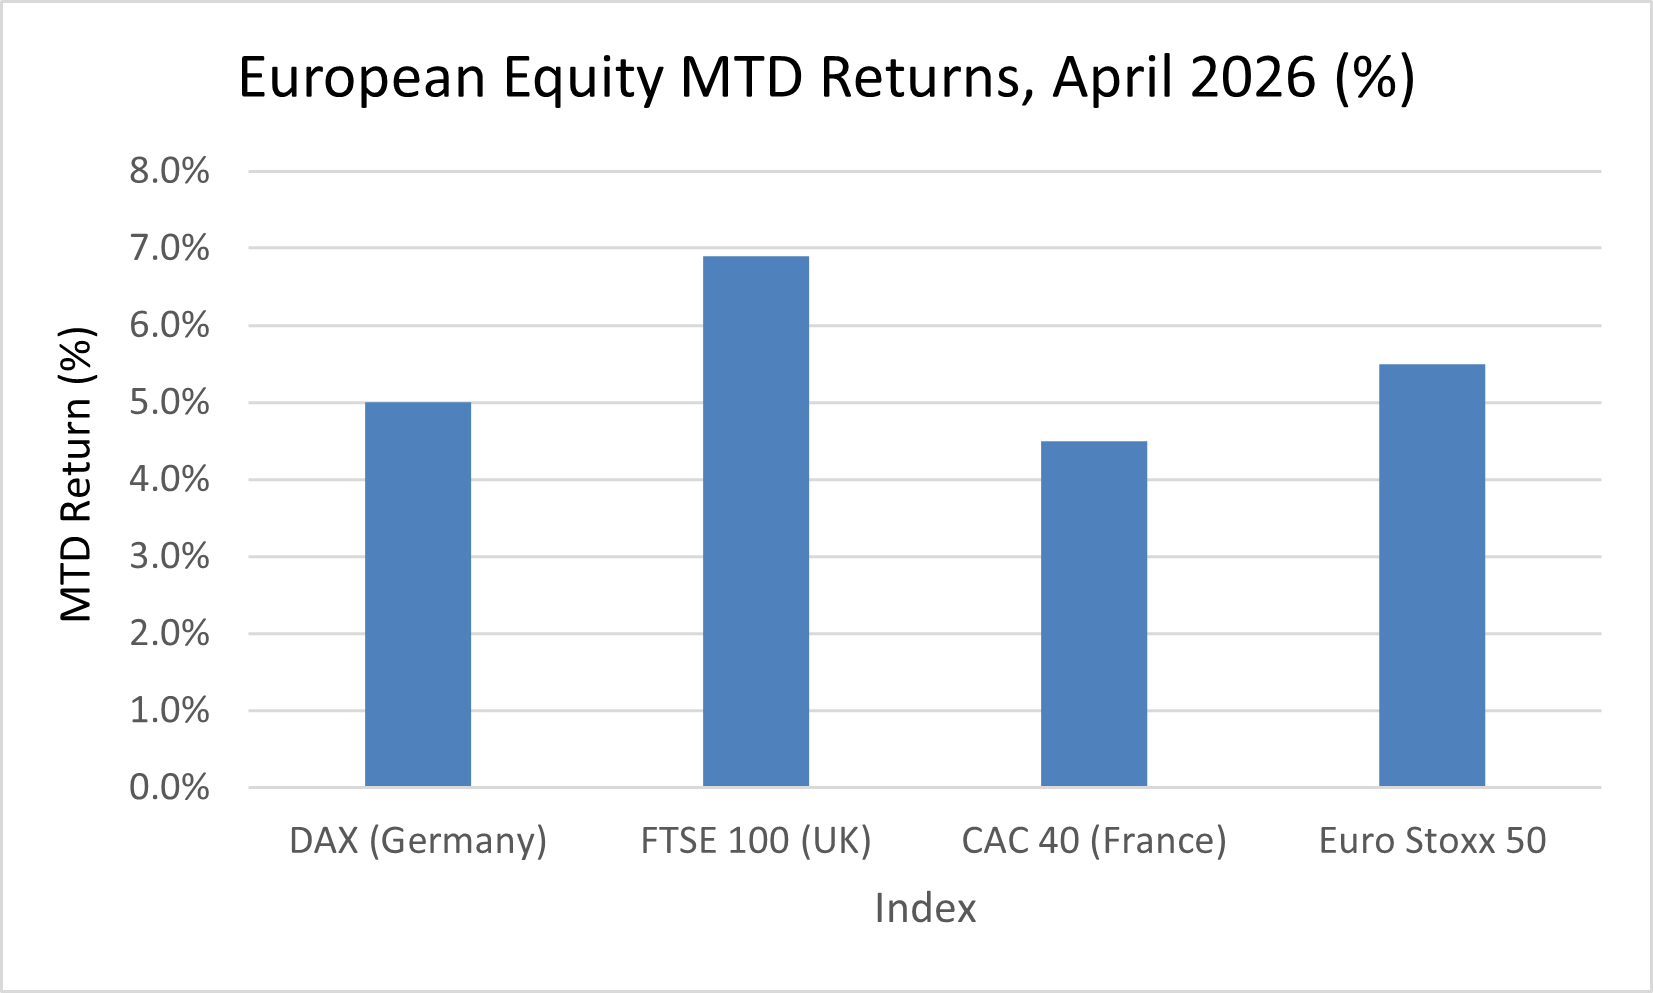
European equity markets posted gains in April but significantly underperformed US and Asian peers. The Euro Stoxx 50 gained approximately 5.5%, the DAX rose roughly 5.0%, the FTSE 100 advanced approximately 6.9%, and the CAC 40 gained around 4.5%. The FTSE 100's relative outperformance within European indices reflected its significant weighting in energy producers and mining companies that benefited from commodity price strength. British Petroleum, Shell, and diversified miners provided a natural hedge against the oil shock that continental European indices, more concentrated in industrials and financials, did not possess.
German equities, despite the DAX's modest headline gain, masked significant intra-sector divergence. Export-oriented automotive and industrial manufacturers benefited from a weaker euro and from pre-conflict stockpiling that temporarily boosted manufacturing orders. However, energy-intensive industrial processors, domestic consumer companies, and financial institutions with exposure to Southern European credit faced meaningful headwinds. The Eurozone Composite PMI's contraction into 48.8 territory confirmed that the headline equity performance was supported by valuation re-rating in specific sectors rather than a broad improvement in the growth environment.
Japan
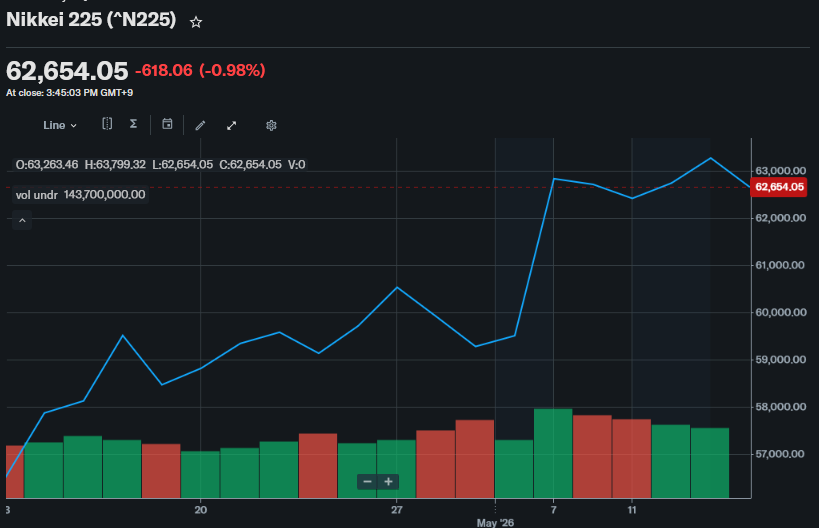
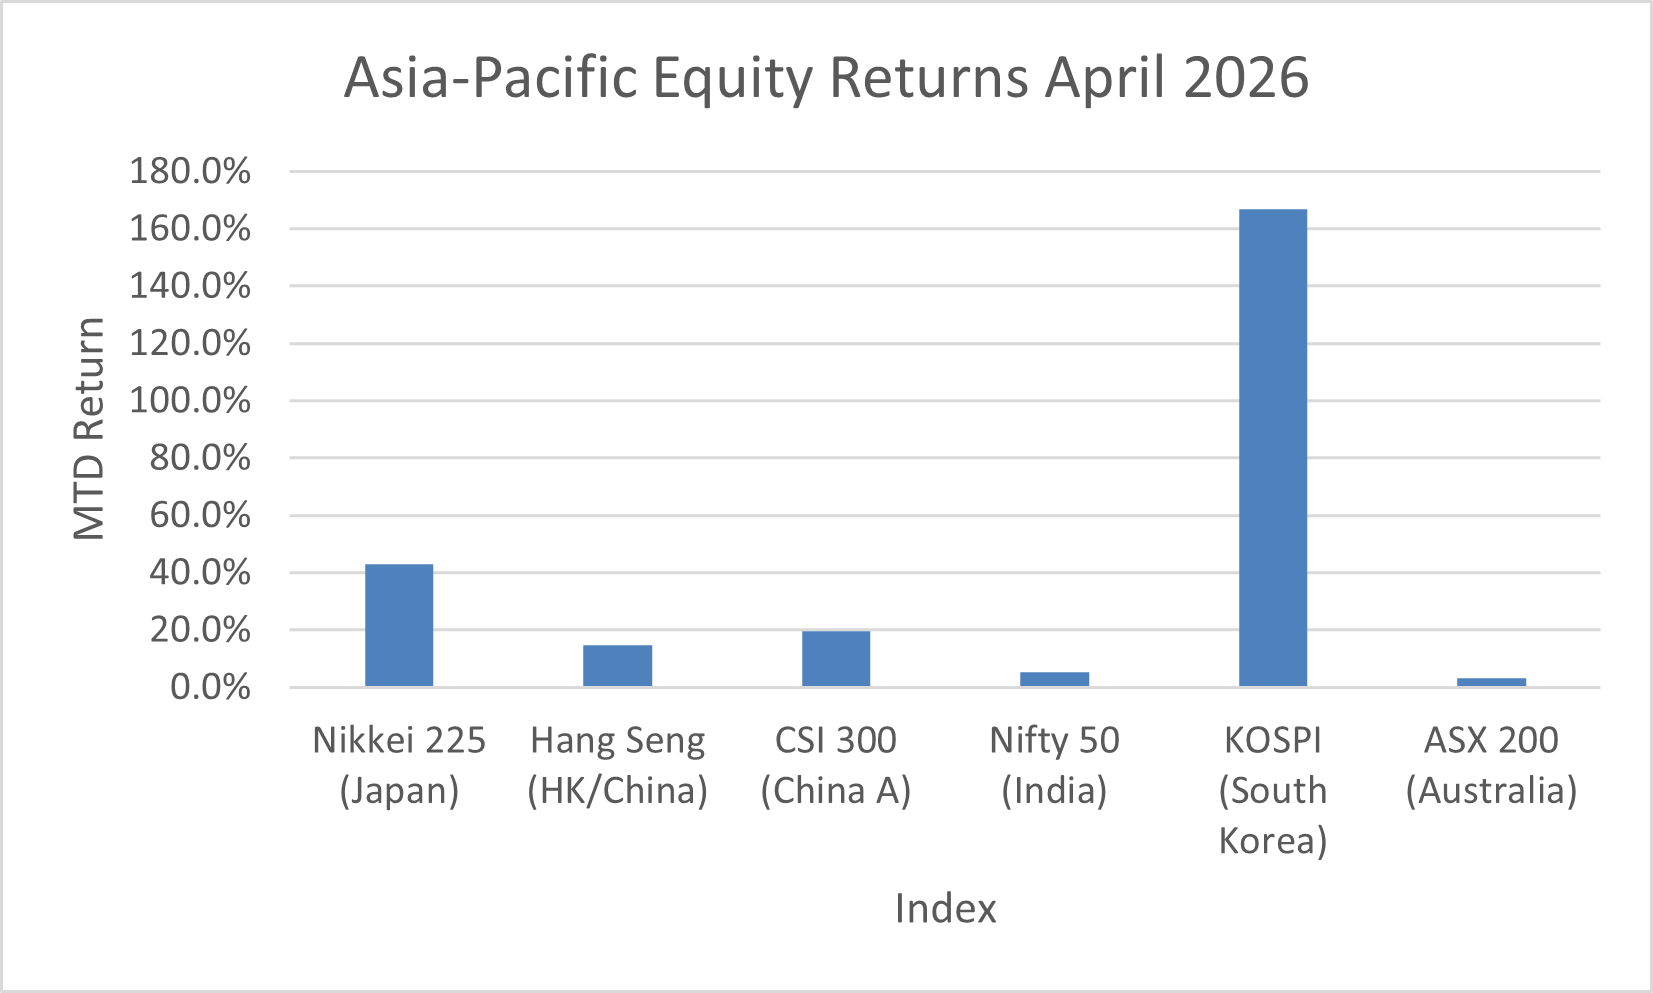
Japan was the clear standout among developed market equity indices in April. The Nikkei 225 advanced approximately 43% during the month, breaking through 60,000 for the first time in the index's history in the second half of April. This extraordinary performance was driven by the convergence of multiple structural and cyclical forces: the strongest manufacturing PMI reading in over twelve years, yen weakness that boosted export earnings, corporate governance reform momentum continuing to drive shareholder return improvements, and a hawkish-hold from the BOJ that affirmed the reflation narrative while maintaining accommodative conditions. The yen's depreciation to the 159 level amplified earnings visibility for large export-oriented industrial and consumer electronics companies. Financials and industrials were the primary sector leaders.
China and Hong Kong
Chinese equity markets delivered significant outperformance in April, with the CSI 300 gaining approximately 19.5% and the Hang Seng Index rising approximately 14.7%. The rally was driven by policy easing expectations, a broad emerging market risk-on move following the ceasefire, and improvement in economic activity data as reflected in the Caixin Composite PMI's rise to 53.1. South Korea's KOSPI achieved exceptional year-to-date returns near 71% as of April 30, driven by semiconductor and AI-related hardware demand. The index's performance reflected structural AI infrastructure investment tailwinds and geopolitical risk premium reduction as Korean manufacturers benefited from supply chain diversification.
Australia and Emerging Asia
The ASX 200 gained approximately 3.0% in April, caught between support from commodity price strength in energy and mining names and drag from elevated borrowing costs and the potential for RBA policy to remain elevated longer than anticipated. Indian equities, as measured by the Nifty 50, rose approximately 5.2%, supported by strong domestic growth and continued foreign inflows, though the pace fell short of Japan and China's headline gains. ASEAN markets were mixed, with Singapore outperforming and Indonesia underperforming amid currency and energy import pressures.
-
S&P 500 Historical Data
https://finance.yahoo.com/quote/%5EGSPC/history
Nasdaq Composite Historical Data
https://finance.yahoo.com/quote/%5EIXIC/history
STOXX Europe 600
https://finance.yahoo.com/quote/%5ESTOXX
Nikkei 225
https://finance.yahoo.com/quote/%5EN225/history
Shanghai Composite
https://finance.yahoo.com/quote/000001.SS/history
VIX Index
Fixed Income and Credit
Fixed income markets in April 2026 went through their most dynamic sequence since the outbreak of the Iran war, as the initial energy shock yielded to partial normalization on ceasefire optimism, before renewed re-steepening into month end as inflation data confirmed the pass-through was broadening into core prices. The month illustrated with exceptional clarity how geopolitical supply shocks interact with monetary policy constraints in ways that conventional rate models fail to anticipate.
United States: Treasury Market Dynamics
US Treasuries began April under pressure from the March inflation surge. The 2-year yield was at 3.79%, the 10-year at 4.31%, and the 30-year at 4.88% as of April 2. As ceasefire negotiations progressed through mid-April, all three tenors moved lower in parallel, reflecting the simultaneous reduction in term premium and near-term inflation expectations. By April 15, the 10-year had pulled back toward 4.20% and the S&P 500 broke 7,000 for the first time.
The month-end configuration reflected the persistence of inflation pressures. The 10-year yield finished April at approximately 4.30% and the 30-year at 4.97%, with the 2-year at 3.88%. This produced a 10Y-2Y spread of approximately 42 basis points, maintaining the positive slope established in December 2025. The Federal Reserve's dual hold in March and April produced four dissents at the April meeting, the highest since 1992, reflecting genuine uncertainty about the appropriate policy stance in a stagflationary supply shock environment. Fed statement language acknowledged elevated inflation while refraining from pre-committing to a tightening bias, leaving markets without forward guidance clarity. Fed funds futures pricing showed zero probability of a 2026 rate cut by month end.
European Fixed Income
European government bond markets reflected the ECB's hawkish pivot. Germany's 10-year Bund yield climbed to 3.03% by April 30, rising approximately 2 basis points through the month but representing a multi-year high. Italy's 10-year BTP yield fell approximately 5 basis points to 3.86%, representing a slight tightening of the Italy-Germany spread to approximately 83 basis points, reflecting improving Italian fiscal credibility and ratings upgrades from all three major agencies during 2025. UK Gilt yields rose more meaningfully, with the 10-year ending April at 5.01%, up 9 basis points, reflecting the Bank of England's acknowledgment of persistent services inflation above 4%.
Japan: JGB Market at Inflection
Japanese government bonds experienced their largest monthly yield move among major developed markets. The 10-year JGB yield rose nearly 17 basis points to end at approximately 2.52%, just below a three-year high, as the BOJ's hawkish hold and sharply revised upward
FY2026 inflation forecasts shifted structural rate expectations. The move had global implications: higher Japanese yields reduce the incentive for global capital to borrow in yen and invest abroad, contributing upward pressure to global long-duration bond yields through the carry trade unwind channel. JGB auctions attracted close scrutiny as indicators of domestic institutional appetite for duration at current yield levels.
Credit Markets: Spreads Resilient Through the Shock
US investment grade credit spreads ended April at approximately 80 basis points over Treasuries, broadly unchanged from the end of March. US high yield spreads were near 285 basis points, also relatively stable. This spread resilience was remarkable given the magnitude of the macro shock absorbed during the month. Corporate balance sheets remained strong entering the shock. Most investment grade and higher-quality high yield issuers had extended debt maturity profiles in the low-rate environment of 2023-2025, creating limited near-term refinancing pressure. Default rates remained low and concentrated in idiosyncratic rather than systemic exposures. The ceasefire narrative also limited the left-tail risk scenario that would have triggered broader spread widening.
Primary market issuance remained functional through April, albeit at moderated volumes. Investment grade issuers accessed markets with manageable concessions, and high yield supply was selective, with stronger-rated issuers completing transactions while highly levered energyconsuming businesses stayed sidelined. The divergence within the credit complex at the issuer level, however, deserves close attention. Energy-intensive shippers, fuel-exposed consumer discretionary companies, and overleveraged energy-consuming manufacturers faced meaningful spread widening even as the broad high yield index remained stable. This idiosyncratic stress is the precursor pattern to systemic widening if the underlying shock persists.
-
US 2 Year Treasury Yield (DGS2)
https://fred.stlouisfed.org/series/DGS2
US 10 Year Treasury Yield (DGS10)
https://fred.stlouisfed.org/series/DGS10
US Investment Grade Corporate Spread (ICE BofA OAS) https://fred.stlouisfed.org/series/BAMLCOA0CM
US High Yield Corporate Spread (ICE BofA OAS) https://fred.stlouisfed.org/series/BAMLH0AOHYM2
Canada 10 Year Government Bond Yield
https://fred.stlouisfed.org/series/IRLTLT01CAM156N
Euro Area 10 Year Government Bond Yield
Commodities & Alternatives
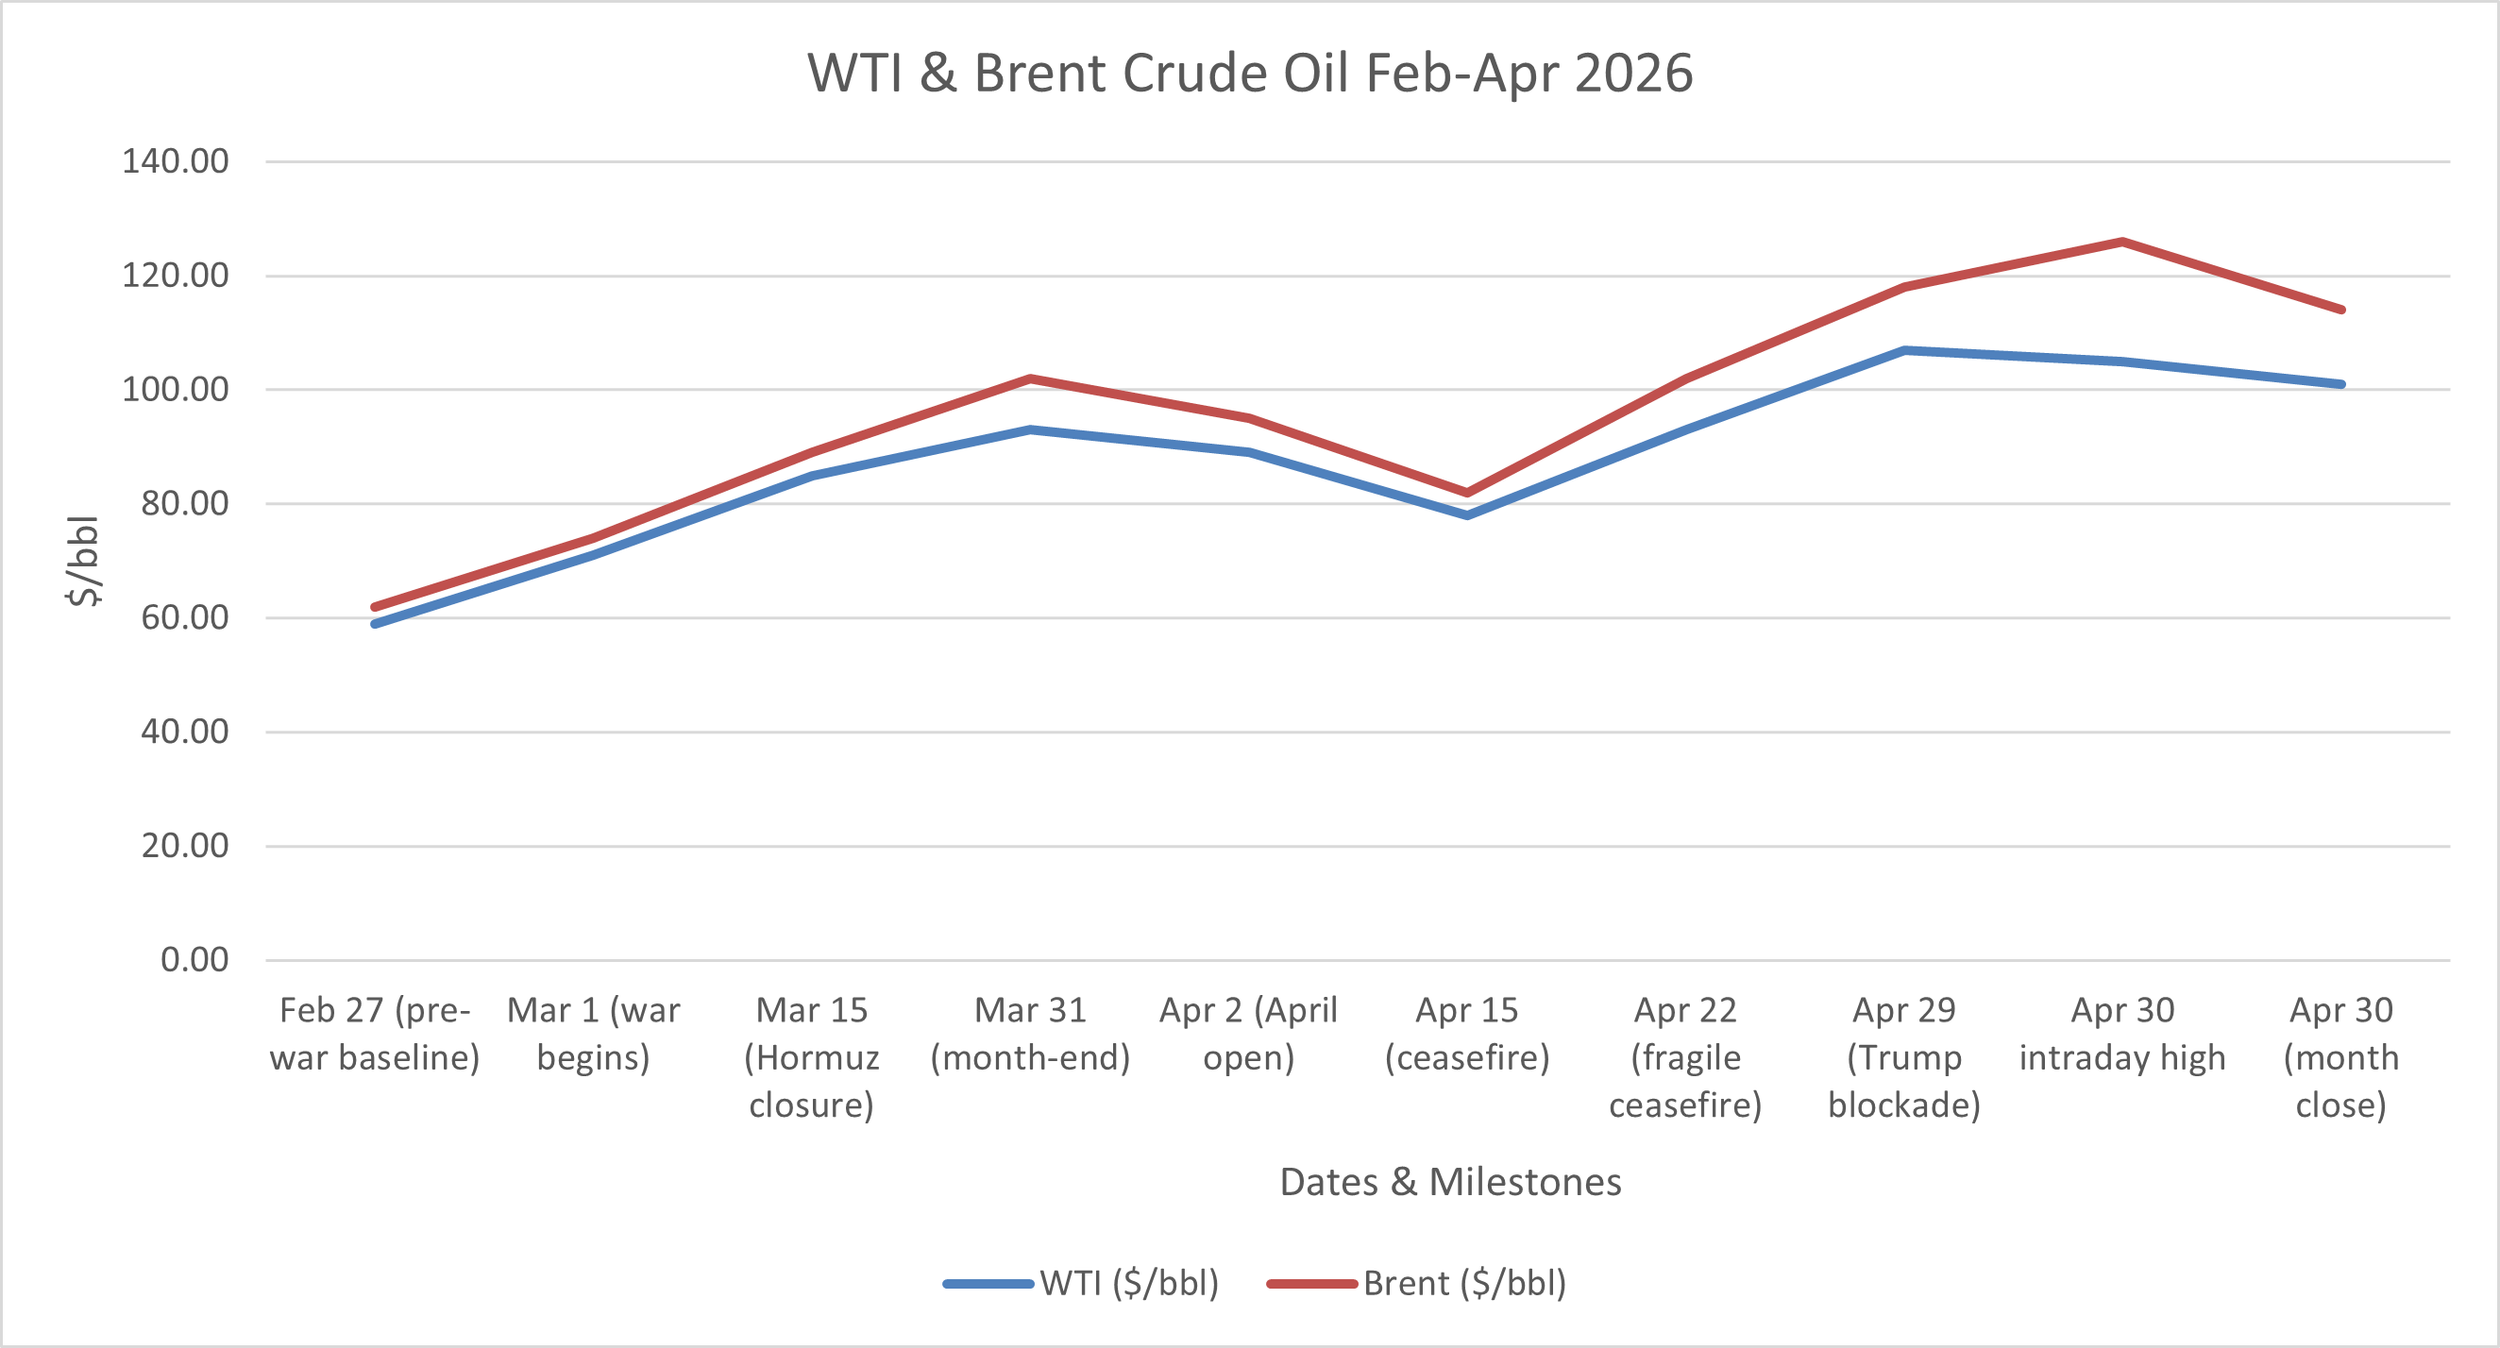
Commodities in April 2026 were defined almost entirely by the Iran war's impact on oil markets, which generated the largest supply shock in the history of global petroleum markets. The shock's magnitude, with Brent crude more than doubling from pre-war levels of approximately $62 per barrel to an intraday high near $126, created distortions across supply chains that PMI data and inflation readings were only beginning to capture by month end.
Energy: Oil and Natural Gas
WTI crude oil began April near $89 per barrel, having already reflected the March surge following the late-February outbreak of the war. As the month progressed, oil prices continued their historic climb. On April 29, WTI settled at $106.88, up nearly 7%, after President Trump confirmed the continuation of the US naval blockade against Iran. Brent crude closed April 29 at $118.03, touching an intraday high near $126 on April 30. Goldman Sachs estimated that exports through the Strait of Hormuz had fallen to just 4% of normal volumes, and global oil consumption in April may have been approximately 3.6 million barrels per day lower than February levels, with demand destruction concentrated in jet fuel and petrochemical feedstocks. Analysts modeled scenarios in which Brent could approach $140-$150 per barrel if the disruption persisted. The UAE's announced withdrawal from OPEC added additional uncertainty to OPEC+ production management.
Natural gas prices reflected the same supply shock but with a somewhat more constrained upside, given European storage levels and US production insulation. European TTF gas futures surged as LNG re-routing from Middle East-linked suppliers tightened global supplies. US Henry Hub moved from approximately $3.90 at the start of April to $4.50 by month end. Energy analysts noted that a reopening of the Strait, should it occur, would likely trigger an immediate $10-$20 decline in crude prices from speculative positioning unwinding, but physical infrastructure damage and lingering production outages would keep Brent anchored well above pre-conflict levels, likely in the $80-$90 range at minimum.
Gold
Gold ended April approximately flat at $4,611 per ounce. The World Gold Council's April commentary attributed this to a fundamental tension between the structural case for gold ownership and the tactical drivers that typically trigger institutional buying. As US equities rallied on ceasefire optimism, risk appetite returned, equity and bond volatility premia eased, and safehaven demand for gold diminished. ETF inflows were strong in April, led by European investors more directly exposed to the economic consequences of the Strait closure. COMEX managed money net long positions saw only a modest increase, remaining in neutral territory. Gold's technical posture was vulnerable near month end, having failed to reclaim its 55-day moving average following March's sharp decline. J.P. Morgan's structural case for gold to approach $5,000 per ounce by end-2026 remained intact: central bank buying trends were unbroken, fiscal sustainability concerns remained elevated, and the bond diversification premium had diminished.
Industrial Metals
Copper prices advanced approximately 7% in April to near $4.50 per pound, driven by supply disruption concerns, broader commodity re-pricing, and ongoing structural demand from electrification infrastructure and AI data center power buildout. The war-related disruption to Middle East industrial supply chains generated precautionary buying, while the underlying demand fundamentals from the global energy transition remained intact. Iron ore prices remained under pressure, declining approximately 6% in April to near $92 per metric ton, reflecting persistent weakness in China's property sector despite sequential stabilization. The divergence between copper (benefiting from new economy demand) and iron ore (constrained by old economy property weakness) illustrated the bifurcation in commodity fundamentals characterizing 2026's unusual macro environment.
Agricultural Commodities and Alternative Assets
Agricultural commodity prices were broadly stable at the headline level, though the energy shock introduced significant upside risks through higher fertilizer costs, transportation costs, and direct farming input costs. Food inflation in the US accelerated modestly to 3.2% year-over-year by April. The pipeline risk from energy-driven input cost inflation was considered a key medium-term concern for food price stability. Real assets faced a complex environment: infrastructure assets with energy exposure benefited from higher commodity price assumptions, while real estate and rate-sensitive infrastructure projects continued to face headwinds from elevated long-term yields. Private credit strategies maintained strong yield generation, though underwriting standards tightened in energy-sensitive sectors.
-
WTI Crude Oil Prices
https://fred.stlouisfed.org/series/DCOILWTICO
Brent Crude Oil Prices
https://fred.stlouisfed.org/series/DCOILBRENTEU
Gold Price (London Bullion Market, USD) https://fred.stlouisfed.org/series/GOLDAMGBD228NLBM
Copper Prices
https://fred.stlouisfed.org/series/PCOPPUSDM
Natural Gas Prices (Henry Hub)
https://fred.stlouisfed.org/series/DHHNGSP
S&P GSCI Commodity Index
Key Themes of the Month
Theme 1: The Iran Shock
April 2026 delivered something that economic textbooks describe but that markets rarely experience cleanly: a genuine stagflationary supply shock. The US-Israel war against Iran, which began at the end of February with airstrikes on Iranian nuclear and military infrastructure, closed the Strait of Hormuz and removed approximately 20% of globally traded oil supply from accessible shipping routes almost overnight. The result was the largest oil supply disruption in the history of the global petroleum market, an energy shock that simultaneously raised the price of nearly every good and service in the economy while suppressing real incomes, consumer confidence, and the growth impulse that central banks had been carefully nurturing through their late-2025 easing cycle. April was the month in which the full macroeconomic implications of that shock became legible in the data, and the picture it revealed was uncomfortable in ways that standard monetary policy frameworks are not well-designed to address.
The Inflation Mechanics of a Supply Shock
To understand why April's inflation data was so analytically significant, it is worth distinguishing between the two sources of inflation that drove the March and April CPI prints. The first and largest was the direct energy price shock. Gasoline prices surged 21.2% in March alone, accounting for nearly three-quarters of the 0.9% monthly CPI gain. Energy costs as a whole rose 10.9% in March and 17.9% year-over-year by April. This component is, in principle, transitory: it reflects a specific supply disruption that can reverse when the disruption ends. The Federal Reserve has historically looked through energy price spikes of this kind, focusing instead on core inflation as the measure of underlying price dynamics. Fed Chair Powell's predecessors had explicitly communicated a willingness to accept temporarily elevated headline readings during supply disruptions without tightening policy in response.
The second source of inflation was more troubling: the April core CPI reading of 2.8% year-overyear and the monthly core gain of 0.4%, the largest since January 2025. Core inflation, by construction, excludes food and energy, so its acceleration in April could not be attributed directly to gasoline. What it reflected instead was the beginning of the pass-through process by which energy cost increases filter into the broader economy. Transportation services rose 4.3% yearover-year, reflecting higher fuel costs for airlines, trucking, and logistics providers. Apparel rose 4.2%, partially reflecting higher shipping and manufacturing input costs. Even shelter, the most persistent component of core inflation and the one the Fed had most carefully monitored, remained elevated at 3.3% annually. The combination of a spiking headline and a rising core put the Federal Reserve in precisely the position it had hoped to avoid: unable to look through the energy shock as transitory because the evidence of second-round pass-through had already begun to appear.
The Treasury Department's TBAC economic policy statement, released in late April, acknowledged the dynamic explicitly. Non-housing core services inflation, the Fed's preferred measure of underlying price stickiness, had averaged 0.4% per month in Q1 2026, up sharply from 0.1% per month in Q4 2025. Over the year through March 2026, non-housing core services inflation was 3.1%, up from 2.9% the prior year. This was not the data profile of a central bank on the cusp of easing. It was the data profile of a central bank being forced to choose between two bad options: hold rates and risk entrenching inflation expectations, or cut rates and risk being seen as capitulating to a supply shock in a way that permanently damages credibility.
The Federal Reserve's Impossible Position
The Fed chose to hold, for the third consecutive meeting, keeping the federal funds rate target at 3.50%-3.75%. But the April meeting revealed, through its dissent count, the degree to which that choice was contested. Four Federal Reserve officials dissented, the highest number since 1992. Three regional presidents voted against language in the statement that they interpreted as preserving optionality for a future cut, arguing that the inflation environment warranted either a tightening bias or an explicit removal of easing-oriented language. One governor, Stephen Miran, voted for an immediate 25 basis point reduction, arguing that the energy shock was supply-side in nature and that tightening in response to it would compound the growth damage without meaningfully reducing prices. The dissent in both directions was itself analytically significant: it illustrated that the standard policy playbook offers no clean answer to a stagflationary shock, and that even experienced policymakers with access to the same data reached opposite conclusions about the appropriate response.
Incoming Fed Chair Kevin Warsh, whose public stance had favored lower rates, found himself in the most difficult position of all. He had been nominated and confirmed on a platform that included skepticism about the previous Fed leadership's inflation-fighting credibility. Now, with inflation reaccelerating and the institution's credibility in question from the opposite direction, the political and institutional constraints on his communication were severe. The April statement navigated these constraints by acknowledging that inflation remained elevated while refraining from precommitting to a particular direction, a formulation that satisfied no constituency fully but preserved maximum optionality as ceasefire negotiations continued.
The market's verdict was unambiguous. By April 30, the CME FedWatch tool showed zero probability of a rate cut at any 2026 FOMC meeting, a complete reversal from the one-cut base case that had prevailed in January. Bank of America had extended its first expected cut to the second half of 2027. JPMorgan projected headline CPI remaining above 3.0% into early 2027. The structural message was clear: the brief window of policy normalization that the Fed had engineered through its three late-2025 cuts had been closed, at least temporarily, by an exogenous shock that the Fed had no ability to prevent and limited ability to offset.
The Growth Side of the Equation
Stagflation is defined not just by elevated inflation but by simultaneously deteriorating growth, and April's data delivered on that dimension as well, though unevenly across regions. In the United States, the growth picture was more nuanced than the Eurozone's. US consumer sentiment hit alltime lows in April, reflecting the squeeze on household real income as wage gains of approximately 3.5%-4.0% annually were overwhelmed by a 0.9% single-month CPI print. Real average hourly wages fell 0.5% for the month and declined 0.3% annually, the first sustained negative real wage growth in three years. This was not an abstract macroeconomic statistic; it represented a direct deterioration in the living standards of working households, and consumer sentiment surveys captured the emotional register of that deterioration clearly.
The services PMI told the same story in activity terms. The S&P Global US Services PMI showed new business intakes falling for the first time in two years in April, with travel, tourism, and financial services the weakest sub-sectors. Consumer spending, which had been the primary engine of US growth resilience throughout 2024 and 2025, was showing the first genuine cracks. The manufacturing PMI remained in expansion at 50.2, supported by stockpiling behavior, but this was a lagging rather than a leading indicator: firms were building inventory ahead of potential further supply disruption, not in response to genuine demand acceleration. The manufacturing strength of April was borrowed from future quarters.
In the Eurozone, the stagflation dynamic was more acute. The Composite PMI fell to 48.8, the first contraction in nearly a year and a half. Services drove the deterioration as consumer-facing businesses absorbed the dual impact of higher energy prices and weakening household confidence. Industrial producers, by contrast, were temporarily lifted by the same stockpiling effect seen in the US, creating the paradoxical situation of a contracting economy with expanding manufacturing. The ECB, caught between inflation at 3.0% in April and a contracting economy, held rates and communicated the dilemma with unusual candor. President Lagarde acknowledged that the governing council had debated a rate hike even as the growth data deteriorated, a posture that could only be sustained because core inflation in the Eurozone remained somewhat better contained than in the US. The ECB's neutral rate posture gave it less room than the Fed to absorb the shock without acting, and the June meeting was rapidly becoming the most consequential European monetary policy decision in several years.
What the Shock Revealed
Beyond the immediate inflation and growth data, April's stagflationary episode revealed structural vulnerabilities that had been obscured during the benign 2024-2025 period. First, it demonstrated that the global economy's energy security remained fundamentally dependent on the Strait of Hormuz in ways that years of diversification investment had not resolved. Approximately 20-21% of global oil trade transited the strait, and the abrupt closure of that route exposed just-in-time supply chains, regional refinery dependencies, and shipping insurance structures that had been optimized for a world without Strait closure risk. Second, it showed that central banks, having barely completed their inflation-fighting cycle, had no conventional policy space to buffer a new supply shock. Rates were already at levels that most neutral rate estimates considered restrictive; any further tightening in response to energy-driven inflation would compound the growth damage without addressing the supply-side cause. Third, it illustrated that the disinflation of 2024-2025 had not fully embedded inflation expectations at 2%. The speed with which headline CPI moved from 2.4% to 3.8% in two months, and the corresponding speed with which short-term inflation expectations repriced, suggested that the anchoring of expectations was shallower than the Fed had hoped.
For investors, the stagflation test of April 2026 produced a clear asset allocation signal that was consistent with prior episodes: energy producers and commodity-linked assets outperformed on the inflation leg, while consumer-facing equities and long-duration bonds underperformed on the growth and rate uncertainty legs. Gold's unusual flatness through the month, despite being a canonical stagflation hedge, reflected the specific dynamics of a ceasefire-interrupted shock rather than a failure of the underlying thesis. The structural case for gold in a world of elevated inflation uncertainty, fiscal fragility, and unreliable bond diversification remained intact even as the tactical trade underperformed.
-
US 2 Year Treasury Yield (FRED)
https://fred.stlouisfed.org/series/DGS2
US 10 Year Treasury Yield (FRED)
https://fred.stlouisfed.org/series/DGS10
US Treasury Auction Results
https://www.treasurydirect.gov/auctions/announcements-data-results/
Japan 10 Year Government Bond Yield (FRED)
https://fred.stlouisfed.org/series/IRLTLT01JPM156N
Euro Area 10 Year Government Bond Yield (FRED)
https://fred.stlouisfed.org/series/IRLTLT01EZM156N
Federal Reserve FOMC Statements
https://www.federalreserve.gov/monetarypolicy/fomccalendars.htm
Bank of Japan Monetary Policy Statements
Theme 2: The Ceasefire Trade
If the Iran shock defined the first half of April, the ceasefire trade defined the second. The mid-April announcement of an initial cessation of hostilities between the United States and Iran triggered one of the most concentrated risk-asset rallies in recent memory, compressing what would normally be weeks of gradual repricing into a matter of days. Understanding the mechanics of the ceasefire trade, why it was so powerful, what it revealed about market positioning, and why it ultimately proved fragile, is essential to interpreting April's asset price movements without being misled by their headline magnitude.
The Mechanics of the Rally
The ceasefire announcement arrived on approximately April 15, when President Trump confirmed diplomatic contact with Lebanese and Israeli officials and signaled a temporary suspension of planned attacks on Iranian infrastructure. Oil prices responded immediately and violently. Brent crude, which had been approaching $100 per barrel, fell sharply as the market unwound the war risk premium that had been building since late February. The sequential logic of the trade was straightforward: lower oil prices meant lower near-term inflation expectations, lower near-term inflation expectations meant a higher probability of eventual Fed rate cuts, higher rate cut probability meant lower real discount rates, and lower real discount rates meant higher present values for every long-duration asset, most acutely for the high-multiple technology stocks that had suffered most in the inflation shock of March.
The S&P 500 crossed 7,000 for the first time in its history on April 15, gaining approximately 3.3% for the week. The Nasdaq, whose concentration in long-duration growth assets made it the most sensitive index to discount rate movements, posted its tenth consecutive daily gain on April 15 and extended the streak to twelve days, its longest winning run since 2009. The LPL Research daily market update on April 15 noted that historically, Nasdaq ten-day winning streaks have been followed by further positive returns 70% of the time with an average additional gain of 1.6%, providing a quantitative anchor for the momentum narrative that further extended buying pressure. Technology stocks led: Nvidia, Micron, and the VanEck Semiconductor ETF posted outsized gains, and Apple touched $300 per share for the first time in its history in late April, completing a rerating that would have seemed implausible six weeks earlier when oil was above $100 and core inflation was accelerating.
By month end, the S&P 500 had delivered a total monthly return of approximately 10.4%, its best performance since November 2020. The Nasdaq finished the month near 24,103, up approximately 9.5% for April. The speed and magnitude of this recovery from the early-April lows was extraordinary by any historical measure, and it was driven almost entirely by the ceasefire narrative rather than by any change in the underlying earnings or macroeconomic fundamentals.
What Positioning Revealed
The ferocity of the ceasefire rally was not simply a function of improving news; it was amplified by the positioning structure that had built up through March and early April. As oil spiked and inflation data deteriorated, institutional investors had reduced equity exposure, built cash positions, and added hedges against further energy price increases. Short interest in technology and growth stocks had risen, and options market positioning reflected elevated demand for downside protection. This positioning overhang meant that when the ceasefire was announced, the rally was driven not just by new buyers but by the forced unwind of short positions, the reinvestment of cash that had been defensively parked, and the mechanical delta-hedging of put options that had been purchased as protection.
The breadth data from the strongest days of the rally confirmed this mechanical character. On the day the S&P 500 advanced most sharply, approximately two-thirds of S&P 500 components were actually lower, with the index return driven almost entirely by a handful of mega-cap technology names with the highest short interest and the largest options open interest. This pattern, in which a small number of stocks drive an outsized index return while the majority of the market underperforms, is a hallmark of short-squeeze driven rallies rather than broad fundamental reratings. It does not mean the rally was illegitimate, but it does mean its magnitude should not be read as a confident macroeconomic verdict.
The VIX index, the standard measure of near-term equity volatility expectations, collapsed from elevated levels during the early-April stress period to the mid-teens by month end. This rapid normalization of volatility premia further amplified asset price gains, as volatility-targeting strategies that had reduced equity exposure during the stress period were triggered to rebuild positions systematically as realized volatility declined. The combination of short covering, cash reinvestment, volatility normalization, and genuine new buying created a self-reinforcing momentum dynamic that drove returns well beyond what a sober assessment of the fundamental improvement warranted.
The Fragility Underneath
The ceasefire trade contained the seeds of its own vulnerability, and by late April those seeds were already germinating. The ceasefire was explicitly described as initial and fragile. Iran had maintained its position that it would not reopen the Strait of Hormuz until the US lifted its naval blockade. The US had maintained that the blockade would continue until Iran agreed to nuclear deal terms. This was not a peace; it was a pause in active hostilities while the underlying strategic disagreements remained entirely unresolved. Oil prices, rather than returning to pre-war levels, stabilized in a range of $90-$115 per barrel, well above the pre-conflict $59-$62 for WTI, reflecting the market's rational assessment that a durable reopening of the Strait was not imminent.
By April 29, as Trump confirmed the continuation of the naval blockade and oil surged back above $106, the fragility was fully exposed. Brent crude hit an intraday high near $126 on April 30, and markets absorbed this reversal without the catastrophic selloff that might have been expected, partly because equity investors had correctly identified the ceasefire trade as conditional from the start and had not fully de-risked the energy shock scenario. The S&P 500 ended April at its highs despite the oil reversal, suggesting that the equity market had, by month end, developed a more sophisticated framework for pricing the Iran shock: one that distinguished between the direct earnings impact on energy-intensive sectors and the broader market's AI-driven earnings momentum, which remained largely insulated from the oil price level.
The Asymmetric Information Content of Asset Classes
Perhaps the most analytically rich observation from the ceasefire trade is the divergence it revealed between what different asset classes were saying about the same macro environment. Equity markets, led by technology, were communicating optimism about corporate earnings resilience and the AI investment cycle. Bond markets, with the 10-year Treasury remaining near 4.30% despite the ceasefire, were communicating persistent inflation uncertainty and elevated term premium. Consumer sentiment surveys were communicating acute distress, with readings at all-time lows. Credit markets were communicating confidence in corporate balance sheets, with spreads near historic tights. Commodity markets were communicating a world of structurally impaired supply.
These signals cannot all be simultaneously correct in every dimension. The most internally consistent interpretation is that equity markets were pricing a narrow and specific set of companies, primarily AI infrastructure beneficiaries, that are genuinely insulated from energy and inflation dynamics through their pricing power, capital-light business models, and exposure to a structural investment cycle that is independent of oil prices. The broader economy, as reflected in consumer sentiment, real wage data, and services PMI trends, was experiencing something considerably more difficult. The ceasefire trade temporarily suppressed the visibility of this divergence by lifting all risk assets simultaneously, but the underlying disparity between the financial market experience and the household economic experience remained one of the most politically and economically significant features of the April 2026 macro landscape.
-
S&P 500 Historical Data (Yahoo Finance) https://finance.yahoo.com/quote/%5EGSPC/history
Nasdaq Composite Historical Data (Yahoo Finance) https://finance.yahoo.com/quote/%5EIXIC/history
STOXX Europe 600 (Yahoo Finance) https://finance.yahoo.com/quote/%5ESTOXX/history
Nikkei 225 (Yahoo Finance)
https://finance.yahoo.com/quote/%5EN225/history
Shanghai Composite (Yahoo Finance) https://finance.yahoo.com/quote/000001.SS/history
CBOE VIX Index (Yahoo Finance)
https://finance.yahoo.com/quote/%5EVIX/history
Global ETF Fund Flows (ETF.com)
https://www.etf.com/etfanalytics/etf-fund-flows-tool
IMF Capital Flows Database
https://data.imf.org/?sk=E3F5F871-EC85-4E24-8EFB-8D3FBD92B5B1
Theme 3: Japan’s breakout
The Nikkei 225's breach of 60,000 in the second half of April 2026 was not merely a round-number milestone. It represented the culmination of a structural transformation in Japanese equity markets that had been building for several years, accelerating through 2025, and reaching its most visible expression in a month defined everywhere else by geopolitical stress and inflationary disruption. That Japan's equity market chose April 2026, of all months, to record the highest closing level in its history speaks directly to the structural, rather than purely cyclical, nature of its re-rating. Understanding Japan's breakout requires separating what was genuinely new from what was already in motion, and assessing whether the forces that drove the Nikkei above 60,000 are durable or whether they represent a peak in a trade that has already largely played out.
The Structural Re-rating: Corporate Governance as the Foundation
The single most important long-term driver of Japan's equity outperformance was not the Iran shock, not the yen, and not the Bank of Japan. It was the multi-year campaign by the Tokyo Stock Exchange, supported by Japan's Financial Services Agency and increasingly by activist investors, to force Japanese corporates to improve their return on equity, reduce cross-shareholdings, and allocate excess capital to shareholders through dividends and buybacks. This campaign, which began in earnest in 2023 with the TSE's formal request that companies with price-to-book ratios below 1.0 publicly disclose plans for improvement, had by 2026 produced measurable changes in corporate behavior across a broad swath of listed Japanese companies.
The evidence was visible in the aggregate data. Return on equity across the Nikkei 225 had improved materially from the chronically low levels that had characterized Japanese corporates for the prior two decades. Share buyback programs had reached record volumes in fiscal year 2025, and dividend payout ratios had risen across sectors. Foreign investors, who had long discounted Japanese equities for their inefficient capital structures and management cultures oriented toward employment stability over shareholder returns, began to revise their assumptions. By early 2026, Japan had re-entered the radar of global institutional allocators as a market where earnings quality was improving, governance was becoming more shareholder-friendly, and valuations, while no longer as cheap as in 2023, remained reasonable relative to the improved fundamentals.
April's activist catalyst was illustrative of this trend. Daikin Industries, the industrial climate control company, was the top performer on the Nikkei 225 during the month after Elliott Investment Management pushed the company to improve capital allocation and operational efficiency. Elliott's engagement, and Daikin's responsive posture, was a microcosm of the broader governance transformation. A decade earlier, a foreign activist targeting a blue-chip Japanese industrial would have been quietly rebuffed through cultural and regulatory mechanisms. In 2026, the engagement was productive, the market rewarded it immediately, and the episode reinforced foreign investors' confidence that Japanese corporates were genuinely changing rather than merely signaling change.
The Manufacturing PMI Signal and Its Implications
Against this structural backdrop, April's economic data provided the most powerful short-term catalyst. The S&P Global Japan Manufacturing PMI reached 52.8 in April, its highest reading since February 2014, more than twelve years earlier. This was not a marginal beat; it was a historically significant acceleration that reflected the convergence of multiple demand forces. Warrelated supply chain hedging had generated a wave of orders for Japanese industrial and electronic equipment manufacturers as global buyers sought to secure supply from reliable nonMiddle Eastern sources. Japan's export-oriented industrial base, which includes some of the world's most sophisticated precision manufacturing operations, was among the primary beneficiaries of this diversification impulse.
The yen's depreciation to the 159 level against the dollar amplified this dynamic. A weaker yen means that the yen-denominated revenues of Japan's export-oriented manufacturers translate into larger dollar earnings for foreign investors, and it means that Japanese products are priced more competitively in export markets. For companies like Toyota, Sony, Fanuc, and the major trading houses, yen weakness at this scale represents a direct earnings tailwind that shows up in quarterly results and in the market's forward earnings estimates. The equity market was pricing this tailwind even before the Q1 2026 earnings reports were released, based on the combination of the PMI signal and the currency move.
Services activity, while somewhat slower than manufacturing at 52.3, remained comfortably in expansion and reflected the ongoing contribution of inbound tourism to Japan's domestic economy. The yen's weakness had made Japan one of the most attractively priced tourist destinations for visitors from the United States, Europe, and other Asian economies, and visitor numbers remained robust through April. This inbound tourism contribution, which flows directly into domestic services consumption, provided a partial offset to the squeeze on household purchasing power from higher import prices, creating a more balanced growth profile than the manufacturing data alone would suggest.
The Bank of Japan: Hawkish Hold and Its Market Read
The Bank of Japan's April 27-28 meeting decision to hold the short-term policy rate at 0.75% was not, in itself, surprising. What was analytically significant was the context in which it was delivered and the market's interpretation of its meaning. The decision passed by a 6-3 vote, with Governors Takata, Tamura, and Nakagawa dissenting in favor of an immediate increase to 1.0%. The BOJ simultaneously published its quarterly Outlook Report, which raised the FY2026 core CPI forecast sharply from 1.9% to 2.8% and cut the FY2026 GDP growth forecast from 1.0% to 0.5%. The inflation forecast revision in particular was extraordinary in its magnitude and explicitly attributed to higher crude oil prices stemming from the Iran war.
The market's interpretation of this hawkish hold was nuanced and, in retrospect, correct. The BOJ was signaling that it viewed the inflation shock as partially structural rather than purely transitory: the upward revision to its CPI forecast incorporated not just the direct energy price effect but also the pass-through to goods and services prices through the wage-price mechanism that the BOJ had been attempting to establish as a durable feature of the Japanese economy. The three dissenters who wanted to hike to 1.0% were making an explicit argument that the energy shock had accelerated the timeline for normalization rather than delayed it, because it had pushed inflation expectations and realized inflation higher at a moment when the BOJ was trying to establish that 2% was the new normal rather than an exception.
For equity investors, this hawkish-hold combination was paradoxically bullish. It affirmed the reflation narrative that had underpinned the Nikkei's re-rating: the idea that Japan had permanently exited its deflationary equilibrium and was now operating in a world of positive nominal growth, positive nominal yields, and improving corporate pricing power. It also preserved the carry trade dynamics that had been supporting yen weakness, since the BOJ was not raising rates aggressively enough to trigger a sharp yen appreciation that would reverse the export earnings tailwind. The 10-year JGB yield rose nearly 17 basis points to 2.52%, a level not seen in years, and Finance Minister Katayama pledged decisive action against further yen weakness, but neither development was sufficient to materially disrupt the equity bull case.
The 60,000 Level: What It Means Structurally
The Nikkei 225's breach of 60,000 requires historical context to be properly appreciated. The index's previous all-time high, reached in December 1989 at the peak of Japan's asset bubble, stood at approximately 38,915. For three and a half decades, that level represented the high-water mark of Japanese financial history and a haunting reminder of what had been lost in the subsequent deflation and stagnation. The recovery to and through that level, which occurred in early 2024, was itself a watershed. The further advance to 60,000 in April 2026, representing a 54% advance from the December 1989 peak in nominal terms, was the market's statement that the re-rating of Japanese equities was not a mean-reversion to a prior peak but a structural revaluation that had moved the index into genuinely new territory.
In valuation terms, the Nikkei at 60,000 was not cheap by the standards of 2023 or even early 2024, but it was not stretched by the standards of global equity markets. Price-to-earnings ratios on a forward basis remained below those of the US S&P 500, and the improvement in ROE across the index provided a fundamental justification for the higher valuation that had not existed at the 1989 peak, when the bubble had been driven by land speculation and financial engineering rather than genuine earnings improvement. Foreign investor flows, which had been the primary driver of the 2024-2025 re-rating, continued through April, reflecting a structural rather than tactical allocation decision by global institutions that had been chronically underweight Japan for decades.
The milestone also carried political and psychological significance within Japan. Three and a half decades of stagnation had embedded a deep cultural skepticism about equity investment among Japanese households, who had historically preferred bank deposits to equities in their savings allocation. Prime Minister Kishida's successor government, like its predecessor, had been actively promoting the NISA individual savings account program to shift household savings into equities. The Nikkei at 60,000 provided the most powerful advertisement for that program: a visible, historically resonant demonstration that the stock market had rewarded long-term investors who had stayed the course through decades of false starts.
Asia's Supporting Cast: Korea, China, and India
Japan's breakout did not occur in a regional vacuum. April 2026 was the strongest month for Asian equity markets broadly, and the regional outperformance relative to Europe and other developed markets reflected both Japan-specific factors and a set of regional tailwinds that applied across multiple markets with different underlying drivers.
South Korea's KOSPI delivered year-to-date returns approaching 71% by April 30, a performance that defied easy categorization. The index's advance was concentrated in semiconductor, display, and AI hardware companies, most prominently Samsung Electronics and SK Hynix, whose products sat at the center of the global AI infrastructure buildout. The same hyperscaler capital expenditure cycle that was driving Nvidia's US equity gains was simultaneously driving demand for Korean memory chips and advanced packaging technology. The Iran war's disruption of global supply chains had, paradoxically, accelerated some of this demand as technology companies sought to build strategic inventory buffers. Korea's KOSPI in April was, in a meaningful sense, the same trade as the Nasdaq's AI rally, expressed through the hardware supply chain.
China's CSI 300 gained approximately 19.5% in April and the Hang Seng rose approximately 14.7%, driven by a combination of renewed policy easing expectations, the broad emerging market risk-on move following the ceasefire, and genuine improvement in the economic activity data as reflected in the Caixin Composite PMI's rise to 53.1. The China rally was structurally different from Japan's: it was policy-driven and sentiment-driven rather than underpinned by governance reform or structural earnings improvement. The property sector remained a weight, and the confidence in the rally's durability was lower among sophisticated investors who had been through multiple false dawns in Chinese equities. But the April performance was real, and it reflected the global capital flow dynamic that tends to benefit emerging market equities when the ceasefire trade suppresses oil prices and reduces the risk premium on global growth.
India's Nifty 50 rose approximately 5.2% in April, a more modest gain that nonetheless reflected the standout position of the Indian economy in the global growth hierarchy. With the HSBC India Manufacturing PMI at 58.3, the highest of any major economy, and domestic consumption remaining robust, India offered a fundamentally different investment case from China or Korea: one anchored in domestic demand, demographic tailwinds, and supply chain diversification investment that was delivering tangible order flow to Indian manufacturers. The more modest equity return relative to Japan, China, and Korea reflected in part the fact that Indian equities had already been substantially re-rated in prior years, leaving less valuation catch-up available.
The regional picture that April 2026 presented, taken as a whole, was one of Asian equity markets in the middle of a multi-year structural re-rating that had different drivers in each market but shared a common feature: all of them were benefiting from the same global capital rotation away from the concentration risk of US mega-cap technology and toward markets offering either lower valuations, higher structural growth, or both. Japan's breakout was the most historically significant expression of this rotation, but it was not isolated.
-
US Investment Grade OAS (FRED)
https://fred.stlouisfed.org/series/BAMLC0A0CM
US High Yield OAS (FRED)
https://fred.stlouisfed.org/series/BAMLH0A0HYM2
Corporate Bond Yields (FRED)
https://fred.stlouisfed.org/series/BAA10Y
Moody's Default Rate Data
https://www.moodys.com/researchandratings/market-segment/corporate/credit-risk
S&P Global Default Statistics
https://www.spglobal.com/ratings/en/research-insights/special-reports/default-transition
Private Credit Market Data (Preqin)
https://www.preqin.com/insights
US Commercial Bank Lending Standards (FRED)
What to Watch For Next Month
May 2026 will be shaped primarily by three tracks: the durability of the Iran ceasefire, the trajectory of core inflation data, and the policy decisions of central banks operating with fewer degrees of freedom than at any point in the post-pandemic cycle. The analytical challenge heading into May is that the resolution of each of these tracks is genuinely uncertain and each carries asymmetric implications for asset pricing.
The Ceasefire: Durability or Breakdown
The ceasefire announced in mid-April remained fragile at month end. Iran had not reopened the Strait of Hormuz, and its stated condition for doing so, the lifting of the US naval blockade, had not been met. The US had maintained the blockade on the stated condition that Iran agree to nuclear deal terms, which Iran had rejected. The tactical pause in active hostilities had been extended, but the fundamental strategic impasse had not been resolved. Goldman Sachs' estimate that Strait exports remained at just 4% of normal volumes confirmed that the physical oil supply disruption was ongoing even as the ceasefire reduced the risk of further escalation.
Markets will be watching for two scenarios in May. In the optimistic scenario, diplomatic progress leads to a Strait reopening agreement, triggering an immediate $10-$20 per barrel decline in crude oil prices as speculative positioning unwinds, a further rally in risk assets as inflation expectations reprice lower, and a meaningful increase in the probability of Fed and ECB rate cuts later in 2026. In the pessimistic scenario, ceasefire talks collapse, oil retests its April highs near $114-$126, and the stagflationary dynamic re-asserts itself with full force. The probability distribution of these outcomes is genuinely unclear and will be the dominant variable for all asset classes through May. Investors who positioned heavily for the ceasefire trade by end-April are carrying substantial event risk into the new month.
The oil options market will be an important real-time signal. Skew in Brent options, which had spiked sharply when the war began and partially normalized during the ceasefire, will reflect the evolving probability distribution for tail outcomes. Similarly, JGB and Bund yield movements will act as early signals of changing inflation and policy expectations if the Strait situation evolves materially in either direction.
Inflation: The Core Broadening Question
The most important data release for May will be the US April CPI report, scheduled for release on May 12 (covering April data). The March print of 3.3% headline and 2.6% core had partially reassured markets that the energy shock was not yet meaningfully broadening into core prices. If the April core reading surprises to the upside, particularly if services components excluding energy accelerate further, the Fed's posture of cautious holding will become increasingly difficult to defend. Any indication that the month-over-month core gain is running above 0.3% for a second consecutive month would materially increase the probability of the Fed adopting a tightening bias in its May statement language, with significant implications for long-duration assets.
For Europe, the ECB's approach to the June meeting will be the dominant fixed income theme through May. Market pricing by end-April assigned over 78% probability to a 25 basis point hike at the June 5 ECB meeting, the first hike since the 2022-2023 tightening cycle. The ECB's communication through May, particularly any speeches by President Lagarde or Chief Economist Lane, will either reinforce or moderate that pricing. If the Eurozone April HICP final reading (due in mid-May) confirms the flash estimate of 3.0% with no moderation in energy pass-through, the case for a June hike will strengthen considerably. If services inflation, which eased modestly to 3.0% from 3.2% in April, continues to slow, the ECB may be able to defer action while maintaining its hawkish optionality language.
Japan's inflation trajectory deserves close monitoring for a different reason. The BOJ's revised FY2026 core CPI forecast of 2.8% implies that core inflation will accelerate through the fiscal year from the current 1.8% March reading, driven by energy pass-through and wage-price dynamics. If April and May Japanese CPI data confirm this acceleration, the three dissenting BOJ governors who voted for an immediate hike in April will have a stronger empirical case for a June hike to 1.0%. Any BOJ rate increase would represent the most significant near-term risk to the Nikkei's breakout, as it would trigger yen appreciation that reduces the earnings tailwind for exportoriented companies.
Equity Markets: Breadth and Earnings Quality
The Q1 2026 earnings season will be concluding in May, and the final tally of results will clarify whether the April equity rally's fundamental premise, that AI-driven earnings momentum can insulate the index from macro headwinds, is supported by the actual numbers. Early results through April had been described as solid and above expectations, but the full picture including energy-intensive sectors, consumer discretionary companies facing real income pressure, and financial institutions with energy-exposed lending books will be clearer by mid-May.
Breadth will be the key technical indicator to watch. If May's equity performance is again driven by a handful of mega-cap technology names while the majority of the S&P 500 underperforms or declines, the concentration risk that characterized the April rally will have become a structural rather than a temporary feature. This distinction matters for the durability of the bull case: a broadbased advance in which earnings recovery is distributing across sectors suggests fundamental health, while a continuation of narrow leadership suggests that the market is increasingly dependent on a small number of stocks whose valuations embed significant execution risk on the AI revenue generation thesis.
For Asian markets, May will test whether Japan's breakout is sustained on fundamental followthrough or gives back some of its April gains as the momentum trade unwinds. The BOJ's communication, yen dynamics, and the Q1 earnings reports from major Japanese industrials will be the key inputs. Korean semiconductor companies reporting Q1 results will provide an important data point on AI hardware demand durability. Chinese equity momentum will depend on whether government policy signals continue to support domestic demand or whether the property sector's continued weakness reasserts itself as the dominant narrative.
Fixed Income: The June Policy Window
The May fixed income environment will be defined by positioning ahead of the June central bank meetings that represent the next genuine policy decision points for the Fed, ECB, and BOJ. US Treasury markets will be sensitive to any shift in Fed communication that moves the statement language toward a tightening bias, which would likely steepen the yield curve further as the 2-year reprices higher while the 10-year remains anchored by term premium rather than policy rate expectations. European sovereign markets will be sensitive to any development that changes the June ECB hike probability in either direction. If the probability moves materially above 80%, peripheral spread widening is likely as markets begin to price fragmentation risk alongside the tightening impulse.
Credit markets heading into May face a specific technical risk: the resumption of primary market issuance following the end-of-April pause. Investment grade supply calendars for May are expected to be heavy as corporates seek to lock in financing before any further rate moves. If investor reception for new deals deteriorates, even modestly, it would signal a change in the credit market's benign assessment of macro risks that the April data had not yet forced. The quality of issuance demand, measured by book cover ratios and new issue concessions, will be a leading indicator of whether April's spread resilience was a genuine expression of credit strength or a temporary artifact of low supply and high liquidity.
Closing Remarks
April 2026 will occupy a specific and instructive place in the memory of anyone who follows markets seriously. It was a month in which the most pessimistic macro reading, a stagflationary oil shock overlaid on an already fragile disinflation, coincided with the most optimistic equity outcome, the S&P 500's best month in over five years, the Nikkei's first-ever close above 60,000, and new all-time highs across US large-cap indices. The month began in crisis and ended in euphoria, separated by a ceasefire announcement that changed the probability distribution of near-term outcomes without resolving any of the underlying structural tensions that had produced the crisis in the first place.
The analytical challenge that April poses is not in explaining any individual piece of it. The oil shock and its inflation consequences follow directly from the war's supply disruption mechanics. The ceasefire trade and its equity consequences follow directly from the positioning structure that had built through March and early April, and from the mathematical reality that lower oil prices mean lower discount rates for long-duration assets. Japan's breakout follows directly from the governance reforms, yen dynamics, and manufacturing momentum that had been accumulating for years and chose April's particular combination of catalysts to reach their most visible expression. Each thread, examined individually, is coherent and well-supported by the data.
The challenge is in holding all the threads simultaneously and recognizing what the month revealed about the structure of the current market environment. April 2026 demonstrated, with unusual clarity, that financial markets and the real economy can diverge significantly and for extended periods when the sources of financial market returns are concentrated in a small number of companies and themes that are genuinely insulated from the forces weighing on households and businesses more broadly. The AI infrastructure investment cycle, the governance-driven re-rating of Japanese equities, and the mechanical dynamics of positioning unwinds are all real phenomena with real fundamental support. But they are not the economy. The 43% of US workers who reported in April surveys that their financial situation had deteriorated over the past year were not wrong about their experience simply because the S&P 500 finished the month at an all-time high.
The Iran shock also reinforced a theme that has appeared in every edition of this memorandum since December 2025: the persistence of higher-for-longer rates as a structural rather than cyclical feature of the current environment. The brief window of policy normalization opened by the Fed's late-2025 cuts closed faster than anyone had anticipated, not because the Fed changed its mind but because an exogenous supply shock re-accelerated inflation before the prior tightening cycle's work had been fully consolidated. The implication for investors is that duration risk will remain a central consideration in asset allocation for the foreseeable future, not because central banks are committed to tightening, but because the fiscal and geopolitical environment is generating a supply of rate uncertainty that no monetary policy communication can fully offset.
Japan's breakout deserves a closing observation that goes beyond the technical analysis. The Nikkei at 60,000 is a statement about time horizons. The investors who participated in Japan's rerating had to hold their conviction through decades of false starts, through the lost decade and the second lost decade, through multiple abortive Abenomics rallies, through countless governance reform announcements that preceded no actual change. The investors who ultimately captured the return were those who correctly identified that the governance transformation was structural rather than cosmetic, and who maintained exposure long enough for that identification to pay off. In a market environment dominated by algorithmic short-termism, momentum strategies, and quarterly earnings fixation, Japan's story is a quiet reminder that the longest and most durable returns in markets tend to come from structural theses whose timelines are measured in years, not weeks.
For members of the High Finance Institute, the April 2026 market environment offers perhaps the most analytically rich single month of study that this memorandum has encountered since its inception. Every major framework, macroeconomic, geopolitical, behavioral, and structural, was stress-tested simultaneously, and each produced insights that the others could not. Mastering the ability to hold these frameworks in tension, to recognize when they converge and when they diverge, and to draw analytical conclusions that are proportionate to the uncertainty involved, is the core intellectual discipline of serious financial analysis. April was a reminder of why that discipline matters.