
Monthly Market Memorandum - March 2026

Contents
Executive Summary
Macro & Market Overview
2.1 Inflation & Rates
2.2 Global Economic Activity
2.3 Equity Markets
2.4 Fixed Income & Credit
2.5 Commodities & Alternatives
Key Themes of the Month
3.1 The Energy Shock and Stagflation Conversation
3.2 The Crumbling Safe Haven: Why Gold Sold Off
3.3 The Credibility Question: Central Banks Under Pressure
What to Watch Next Month
Closing Remarks
Executive Summary
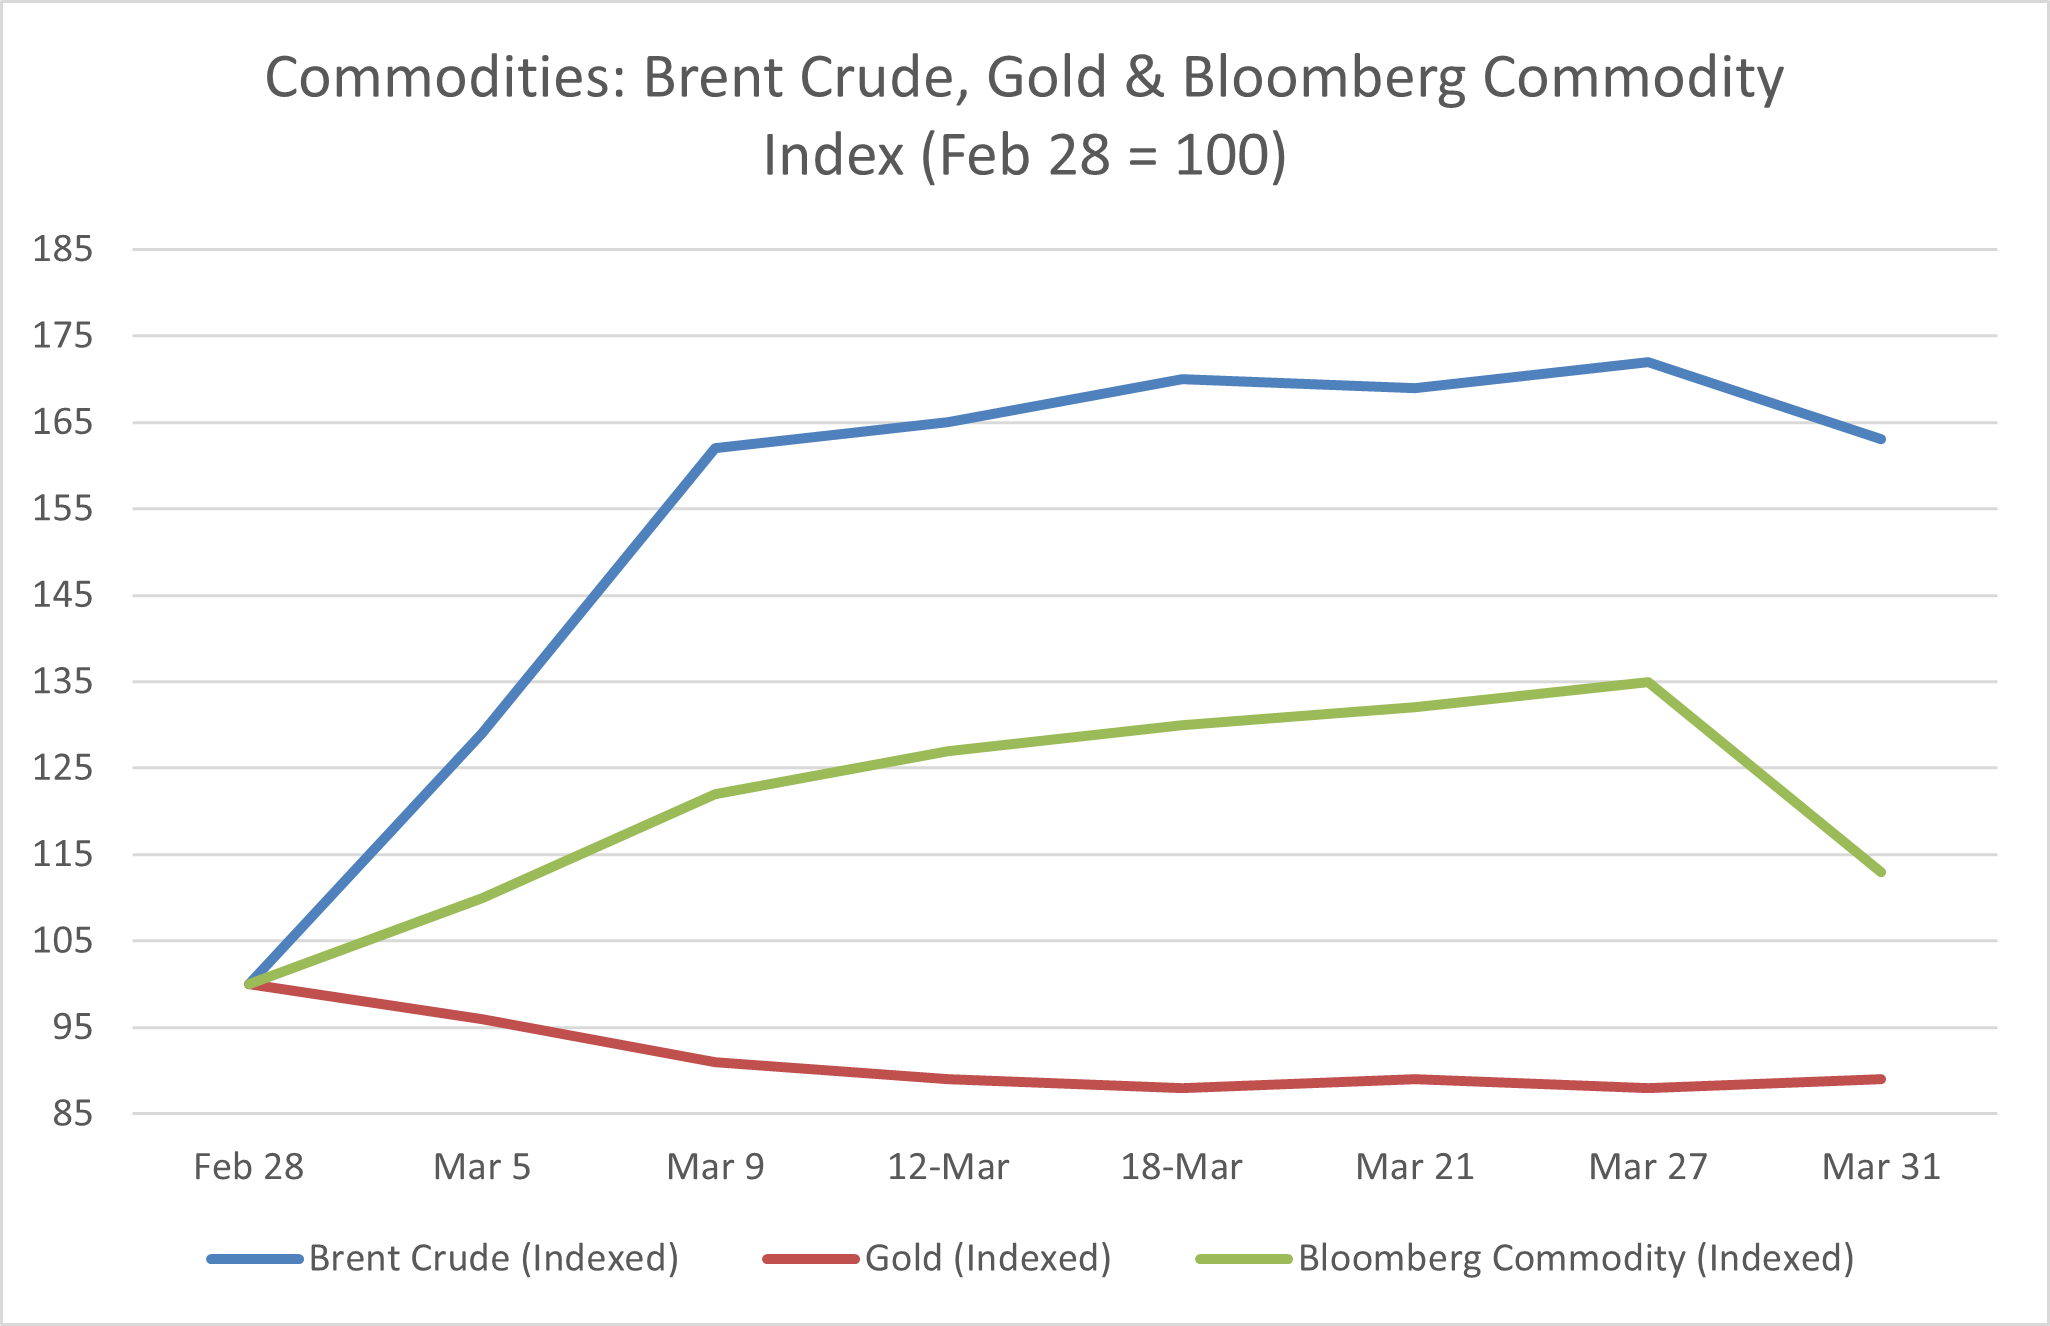
March 2026 will be remembered as a month in which a single geopolitical event displaced the entirety of the preceding macroeconomic narrative and forced every market participant to reassess inflation, policy, and risk simultaneously. The US-Israeli joint air strikes on Iran on February 28, and the subsequent de facto closure of the Strait of Hormuz, triggered the largest supply disruption to global oil markets in recorded history, surpassing the 1973 OPEC embargo by the scale of barrels taken offline. Gulf producers including Saudi Arabia, the UAE, and Iraq shut in production as storage tanks reached capacity with no tankers permitted to load. The IEA estimated global oil supply fell by approximately 8 million barrels per day in March alone, with outages peaking above 9 million barrels per day in April. Brent crude began the month near 72 dollars per barrel, surpassed 100 dollars on March 12, and traded within range of 120 dollars by the final week of the month. The Bloomberg Commodity Index posted its strongest monthly gain since May 2009, rising 11.2%.
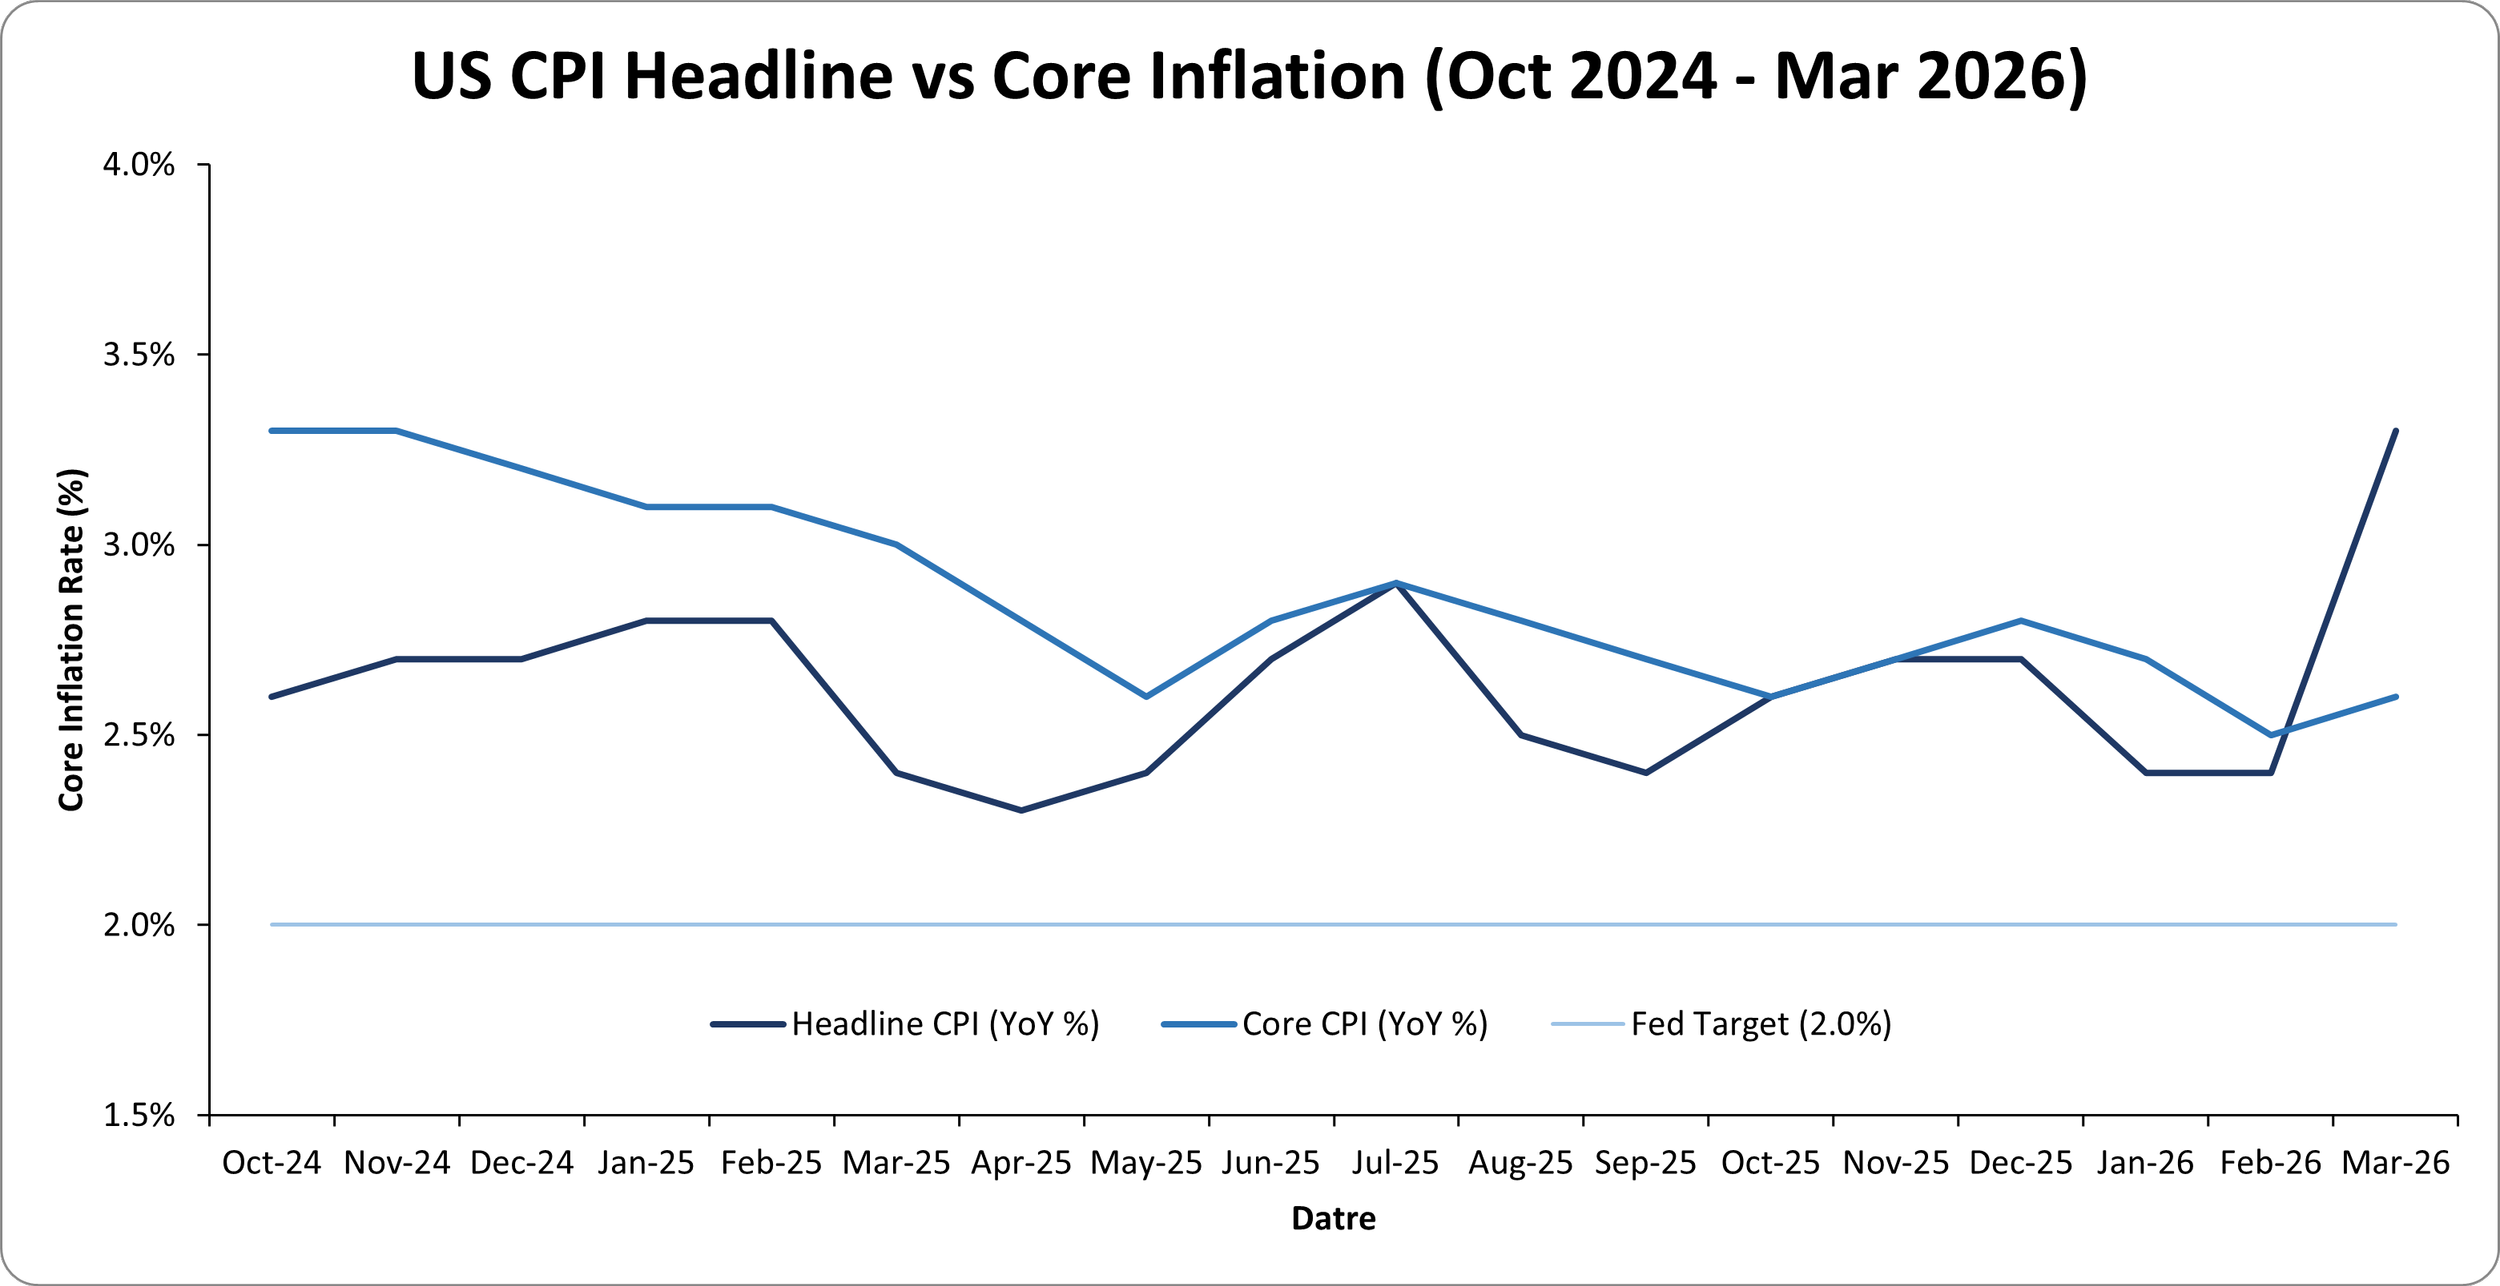
The energy shock had an immediate and cascading effect across every asset class. US headline CPI jumped to 3.3% year-on-year in March, up sharply from 2.4% in February, driven by a 10.9% surge in energy costs and a 21.2% monthly spike in gasoline prices. Core CPI, which strips out food and energy, held at 2.6% annually, demonstrating that underlying demand-side inflation remained controlled even as the headline number surged. The distinction matters enormously for monetary policy. The Federal Reserve held the federal funds rate at 3.5% to 3.75% at its March 18 meeting in an 11-1 vote, raised its 2026 PCE inflation forecast from 2.4% to 2.7%, and the dot plot compressed to one projected cut remaining for the year. Seven of 19 FOMC participants indicated they now expect no cuts at all in 2026. Chair Powell stated it was too soon to know the full economic impact of the conflict.
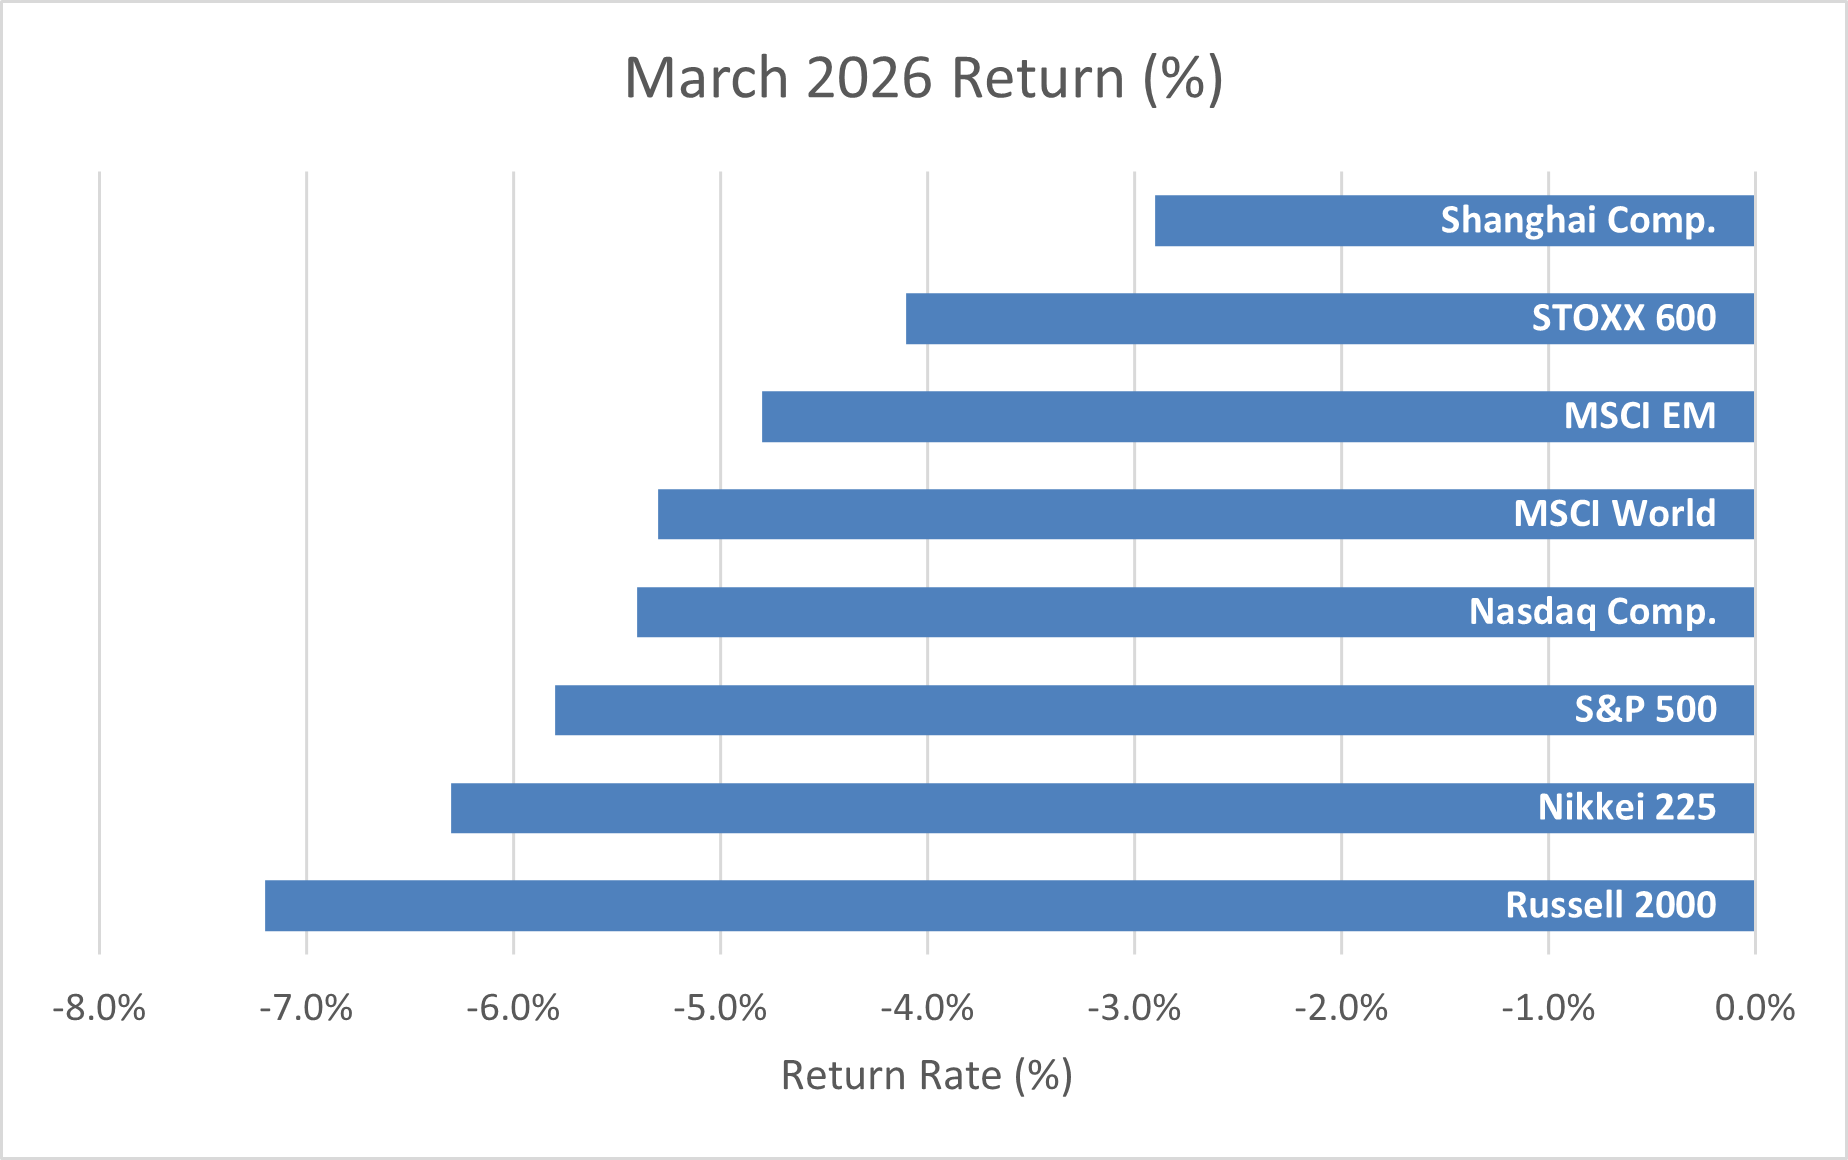
Equity markets sold off broadly and with unusual uniformity. The S&P 500 declined approximately 5.8% for the month, the Nasdaq Composite fell 5.4%, and the Russell 2000 lost 7.2%. The selloff was notable not for its magnitude but for its character: growth and value fell together, equal-weight indices underperformed cap-weighted ones in some regions, and diversification across styles provided limited protection. This correlated de-risking reflected the market recognition that an energy-driven inflation shock simultaneously reduces purchasing power, complicates Fed optionality, and introduces recession risk through demand destruction. Traditional safe-haven behavior broke down. Gold fell 11.6% and silver declined 19.9%, an unusual divergence from the historical role of precious metals during geopolitical stress.
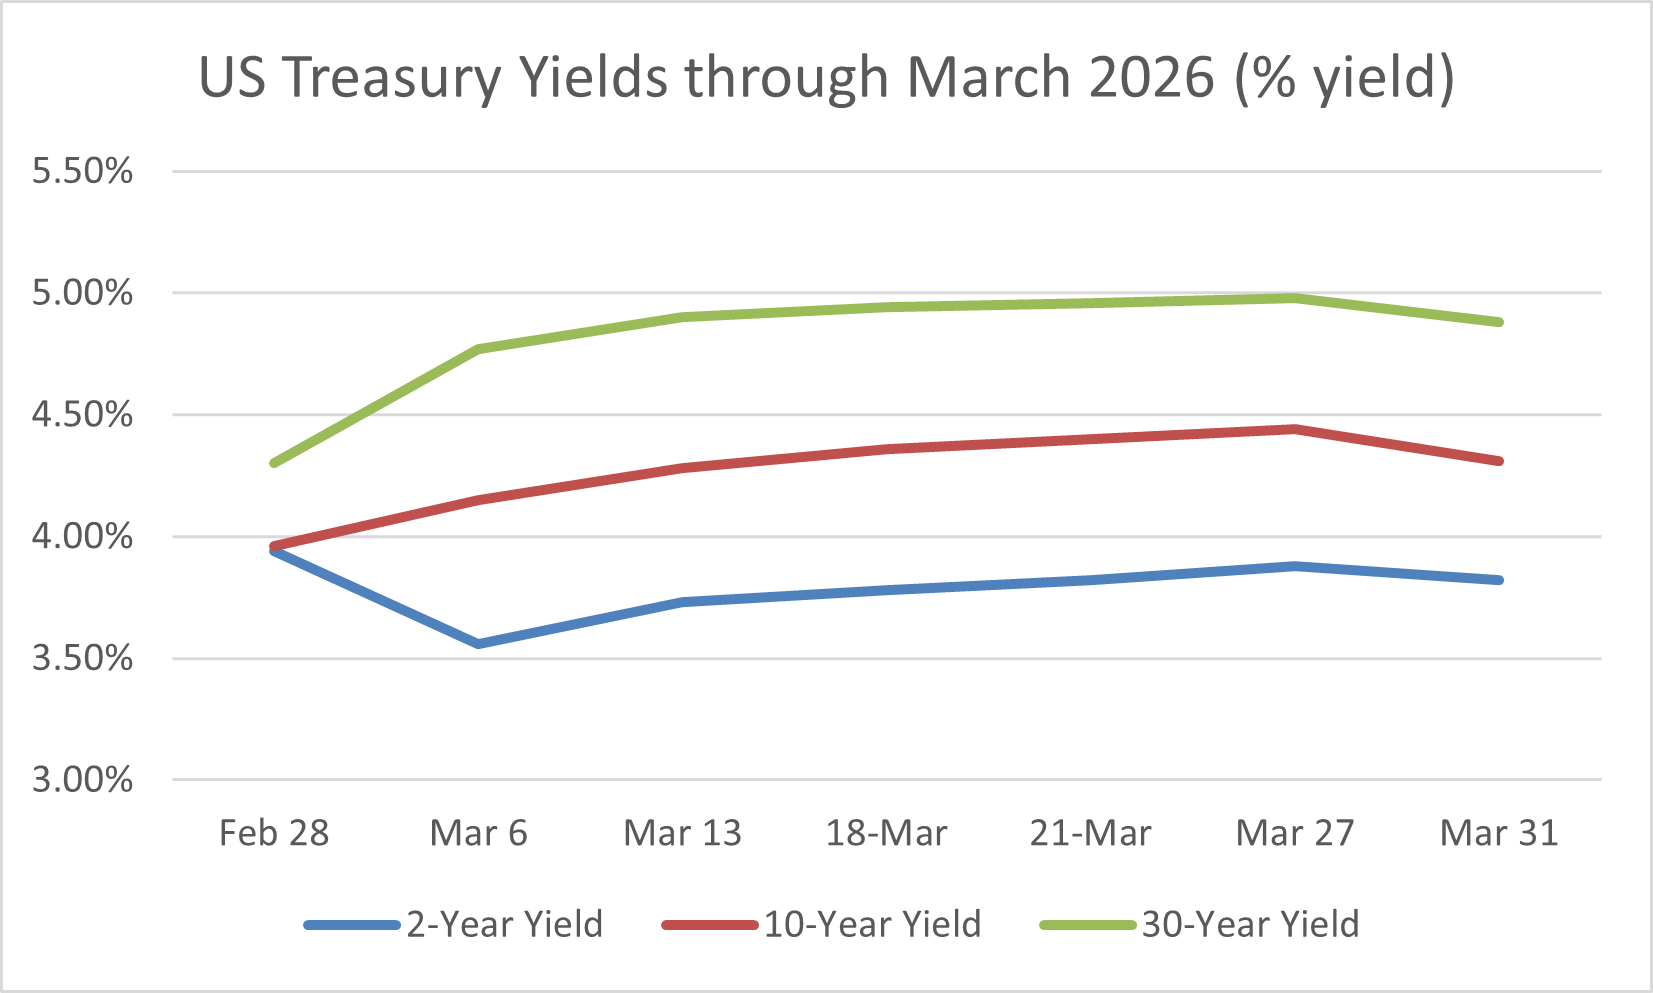
Fixed income produced one of its most complex months in recent memory. US Treasury yields rose sharply across the curve as energy-driven inflation expectations increased, with the 10-year yield climbing from 3.96% at the end of February to 4.44% by March 27. This represented a bear steepening as the energy shock complicated the Fed's ability to cut rates even as growth signals softened. Credit markets showed more resilience than equities, with investment-grade and high-yield spreads widening modestly but remaining well below levels that would indicate systemic stress, reflecting continued confidence in corporate balance sheets.
A two-week ceasefire between the US and Iran was announced at the start of April, and energy prices began to moderate. However, the ceasefire is fragile, tanker rerouting will take months to normalize, and the 13 million barrels per day of Gulf production that was shut in cannot restart quickly. The physical market for Brent crude spot delivery was still pricing 124 dollars per barrel in early April, nearly 30 dollars above the June futures contract, demonstrating that actual scarcity persists even as forward prices reflect ceasefire optimism. March's events have permanently altered the global risk landscape for 2026.
Macro & Market Overview
Inflation & Rates
February's memo closed with a constructive inflation outlook. Headline CPI in the US had held at 2.4%, core was tracking toward target, and bond markets were gently pricing in one to two Federal Reserve cuts by year-end 2026. March inverted that setup almost entirely within the first two weeks of the conflict. Crude oil prices transmit into headline CPI through two primary channels: gasoline at the pump, which is included directly in CPI's energy subcomponent, and transportation costs, which filter into goods and services prices with a short lag. With gasoline surging 21.2% in a single month, the March CPI print was essentially predetermined once oil moved above 100 dollars per barrel.
The official March CPI reading from the Bureau of Labor Statistics confirmed the energy-driven surge. Headline CPI rose 0.9% on a monthly seasonally adjusted basis, the largest single-month increase since June 2022 and the 22nd consecutive month in which annual CPI remained above the Federal Reserve's 2% target. On a year-on-year basis, the rate jumped to 3.3%, the highest since April 2024 and a full 90 basis points above the February reading of 2.4%. The energy component accounted for nearly three-quarters of the headline increase, rising 10.9% year-on-year. Fuel oil surged 44.2% on a monthly basis. The overall energy complex rose 12.5%.
The core reading told a fundamentally different story. Excluding food and energy, CPI rose just 0.2% for the month and 2.6% from a year ago, both 0.1 percentage point below the consensus forecast. Shelter inflation, the stickiest component throughout the post-pandemic disinflation cycle, rose 0.3% monthly and 3.0% annually, its joint-lowest reading since August 2021. Services excluding energy rose 0.2% for the month and 3.0% on a year-on-year basis. Food prices were flat for the month. Average hourly earnings rose just 0.2% for the month and 3.5% on a year-on-year basis, the lowest annual pace since May 2021. This bifurcation between a surging headline and a well-contained core is the defining analytical feature of March's inflation environment, and it separates this episode from the demand-driven inflation cycle of 2021 and 2022.
The Federal Reserve's Dilemma
The FOMC met on March 17 and 18 and voted 11-1 to hold the federal funds rate at 3.5% to 3.75%, with the single dissenter, Governor Stephen Miran, favoring a 25 basis point cut in response to deteriorating labor market conditions. The post-meeting statement added the explicit acknowledgment that the implications of developments in the Middle East for the US economy are uncertain, bringing energy prices and geopolitics formally into the policy language for the first time.
The updated Summary of Economic Projections was more consequential than the rate decision itself. The Fed raised its 2026 PCE inflation forecast from 2.4% to 2.7%, a 30 basis point upward revision described as the largest single-cycle upward revision in recent memory. Core PCE was revised identically to 2.7%. GDP growth for 2026 was nudged upward to 2.4%, reflecting solid carryover from 2025 and continued technology investment activity. Unemployment projections were held near 4.4%. The dot plot showed one cut remaining for 2026, but seven of 19 FOMC participants now indicated a preference for no cuts at all this year, and the longer-run neutral rate estimate edged up to 3.125%.
Chair Powell stated that near-term inflation expectations had risen, likely reflecting the substantial rise in oil prices caused by the supply disruptions in the Middle East, and that the committee would need to assess whether the energy shock was producing lasting second-round effects on wages and services prices before considering any policy response. Goldman Sachs Asset Management summarized the framework directly: the Fed will look through the energy-driven noise so long as secondary effects on wages and services inflation remain contained. That conditionality is now the central variable in the monetary policy debate for the remainder of 2026.
There is also a political dimension worth acknowledging. President Trump continued to publicly pressure Chair Powell, including calling for an emergency rate cut and having the Justice Department issue a subpoena related to the Fed's headquarters renovation project. Powell resisted and accused the administration of procedural pressure designed to influence monetary policy. Powell's term ends in May 2026, and nominated successor Kevin Warsh is expected to adopt a more accommodative stance. Markets are already beginning to price this institutional transition, adding a layer of complexity that is genuinely novel in modern Fed history.
United States
The US entered March with the most constructive core inflation readings since before the post-pandemic surge. The shelter component, which had been the most persistent source of stickiness throughout 2024 and 2025, has now moved decisively lower, providing structural support for core stability. Tariff-related pressures were visible but modest. Airline fares jumped 2.7% for the month and apparel climbed 1.0%, categories flagged as the most direct conduits for tariff pass-through from imported goods. The services excluding energy component rose just 3.0% year-on-year, giving Fed officials confidence that the March headline surge was supply-side and transitory rather than a re-ignition of demand-driven inflation.
Canada
Canada's inflation picture in March was shaped by the same energy shock but with structurally different transmission dynamics. Canada is a net oil exporter, meaning higher crude prices generate fiscal revenue and support energy sector employment even as gasoline costs rise for consumers. The Bank of Canada maintained its policy rate while acknowledging heightened global uncertainty. The primary transmission risk for Canada runs through financial conditions rather than domestic energy prices. A stronger US dollar, wider global credit spreads, and reduced risk appetite tightened effective borrowing conditions for Canadian businesses and households even without a domestic rate hike. Canada's mortgage-heavy household sector remains the most sensitive pressure point for any deterioration in financing conditions.
Eurozone
Euro area headline HICP inflation rose sharply to 2.5% in March from 1.9% in February, narrowly below the market consensus of 2.6%. Europe is more exposed than North America to Middle Eastern crude and LNG, given its import dependence and the infrastructure constraints laid bare during the 2022 energy crisis. European natural gas prices surged as Qatari LNG tankers could not safely load, and strategic storage levels began drawing faster than seasonal norms. The ECB held its deposit rate at 2.0% but signaled extreme caution. OIS futures markets were partly pricing in rate hikes for 2026, a dramatic reversal from the start of the year when two to three additional cuts were the base case. Even before the energy shock, ECB wage indicators showed negotiated wage growth of 3.25% to 3.5%, well above the pre-pandemic norm of 1.8%, keeping services prices elevated. Germany contracted again in March, and France and Italy recorded contractions in services activity, constraining the ECB's ability to hike in response to a supply-side shock even as markets begin pricing that possibility.
Asia
Japan's headline CPI was pushed higher by energy costs in March while core-core CPI continued to hold around 3.2%, underpinned by the strongest wage cycle Japan has seen since the early 1990s. The 2026 Shunto wage negotiations delivered increases broadly consistent with or above those of 2025, confirming that Japan's wage-price dynamic has become durable and self-sustaining. The Bank of Japan held its policy rate, citing uncertainty about whether the energy shock would feed into broader second-round effects. The yen moved modestly weaker in the early weeks of the conflict before stabilizing as ceasefire news emerged.
China's inflation picture remained dominated by domestic dynamics. CPI oscillated between 0% and 0.5% as weak domestic demand, property sector overhang, and excess industrial capacity continued to suppress price pressures. PPI remained deeply negative at around -2.3%. The government moved quickly to access strategic petroleum reserves and divert vessel routing through alternative channels, moderating the domestic price impact in the near term. The People's Bank of China maintained its easing posture, lowering the loan prime rate and providing additional liquidity. India and the ASEAN economies experienced moderate headline inflation increases, largely through energy and food cost transmission, with central banks holding rates steady in a wait-and-see posture.
-
US Headline CPI (CPIAUCSL)
https://fred.stlouisfed.org/series/CPIAUCSL
US Core CPI (CPILFESL)
https://fred.stlouisfed.org/series/CPILFESL
US 2 Year Treasury Yield (DGS2)
https://fred.stlouisfed.org/series/DGS2
US 5 Year Treasury Yield (DGS5)
https://fred.stlouisfed.org/series/DGS5
US 10 Year Treasury Yield (DGS10)
https://fred.stlouisfed.org/series/DGS10
Federal Funds Target Rate
https://fred.stlouisfed.org/series/DFEDTARU
Federal Reserve Policy Statements
https://www.federalreserve.gov/monetarypolicy/fomccalendars.htm
European Central Bank Key Interest Rates
https://www.ecb.europa.eu/stats/policy_and_exchange_rates/key_ecb_interest_rates/html/index.en.html
Bank of Japan Policy Rates
https://www.boj.or.jp/en/statistics/boj/other/discount/index.htm
Global Economic Activity
The global economy entered March 2026 with more constructive momentum than at any point in 2025. The J.P. Morgan Global Manufacturing PMI had been trending higher since late 2025, US manufacturing was expanding at its fastest pace since 2022, and February's ISM Services PMI of 56.1 was the strongest reading since August 2022. That constructive reading did not survive the month intact. The combination of the energy shock, higher input costs, rising consumer uncertainty, and a sharp deterioration in business sentiment in the final two weeks of March erased most of the earlier momentum. The US S&P Global Composite PMI ended March at a revised 50.3, its weakest reading since September 2023. The ISM Services PMI fell from 56.1 in February to 54.0 in March. The ISM Services prices paid subindex surged to 70.7, the highest since October 2022, as higher fuel and energy costs began flowing directly into services operating expenses. The survey's chair noted that the predominant commentary this month was about impacts and adjustments due to the conflict with Iran and the expected flow-through of higher oil prices.
United States
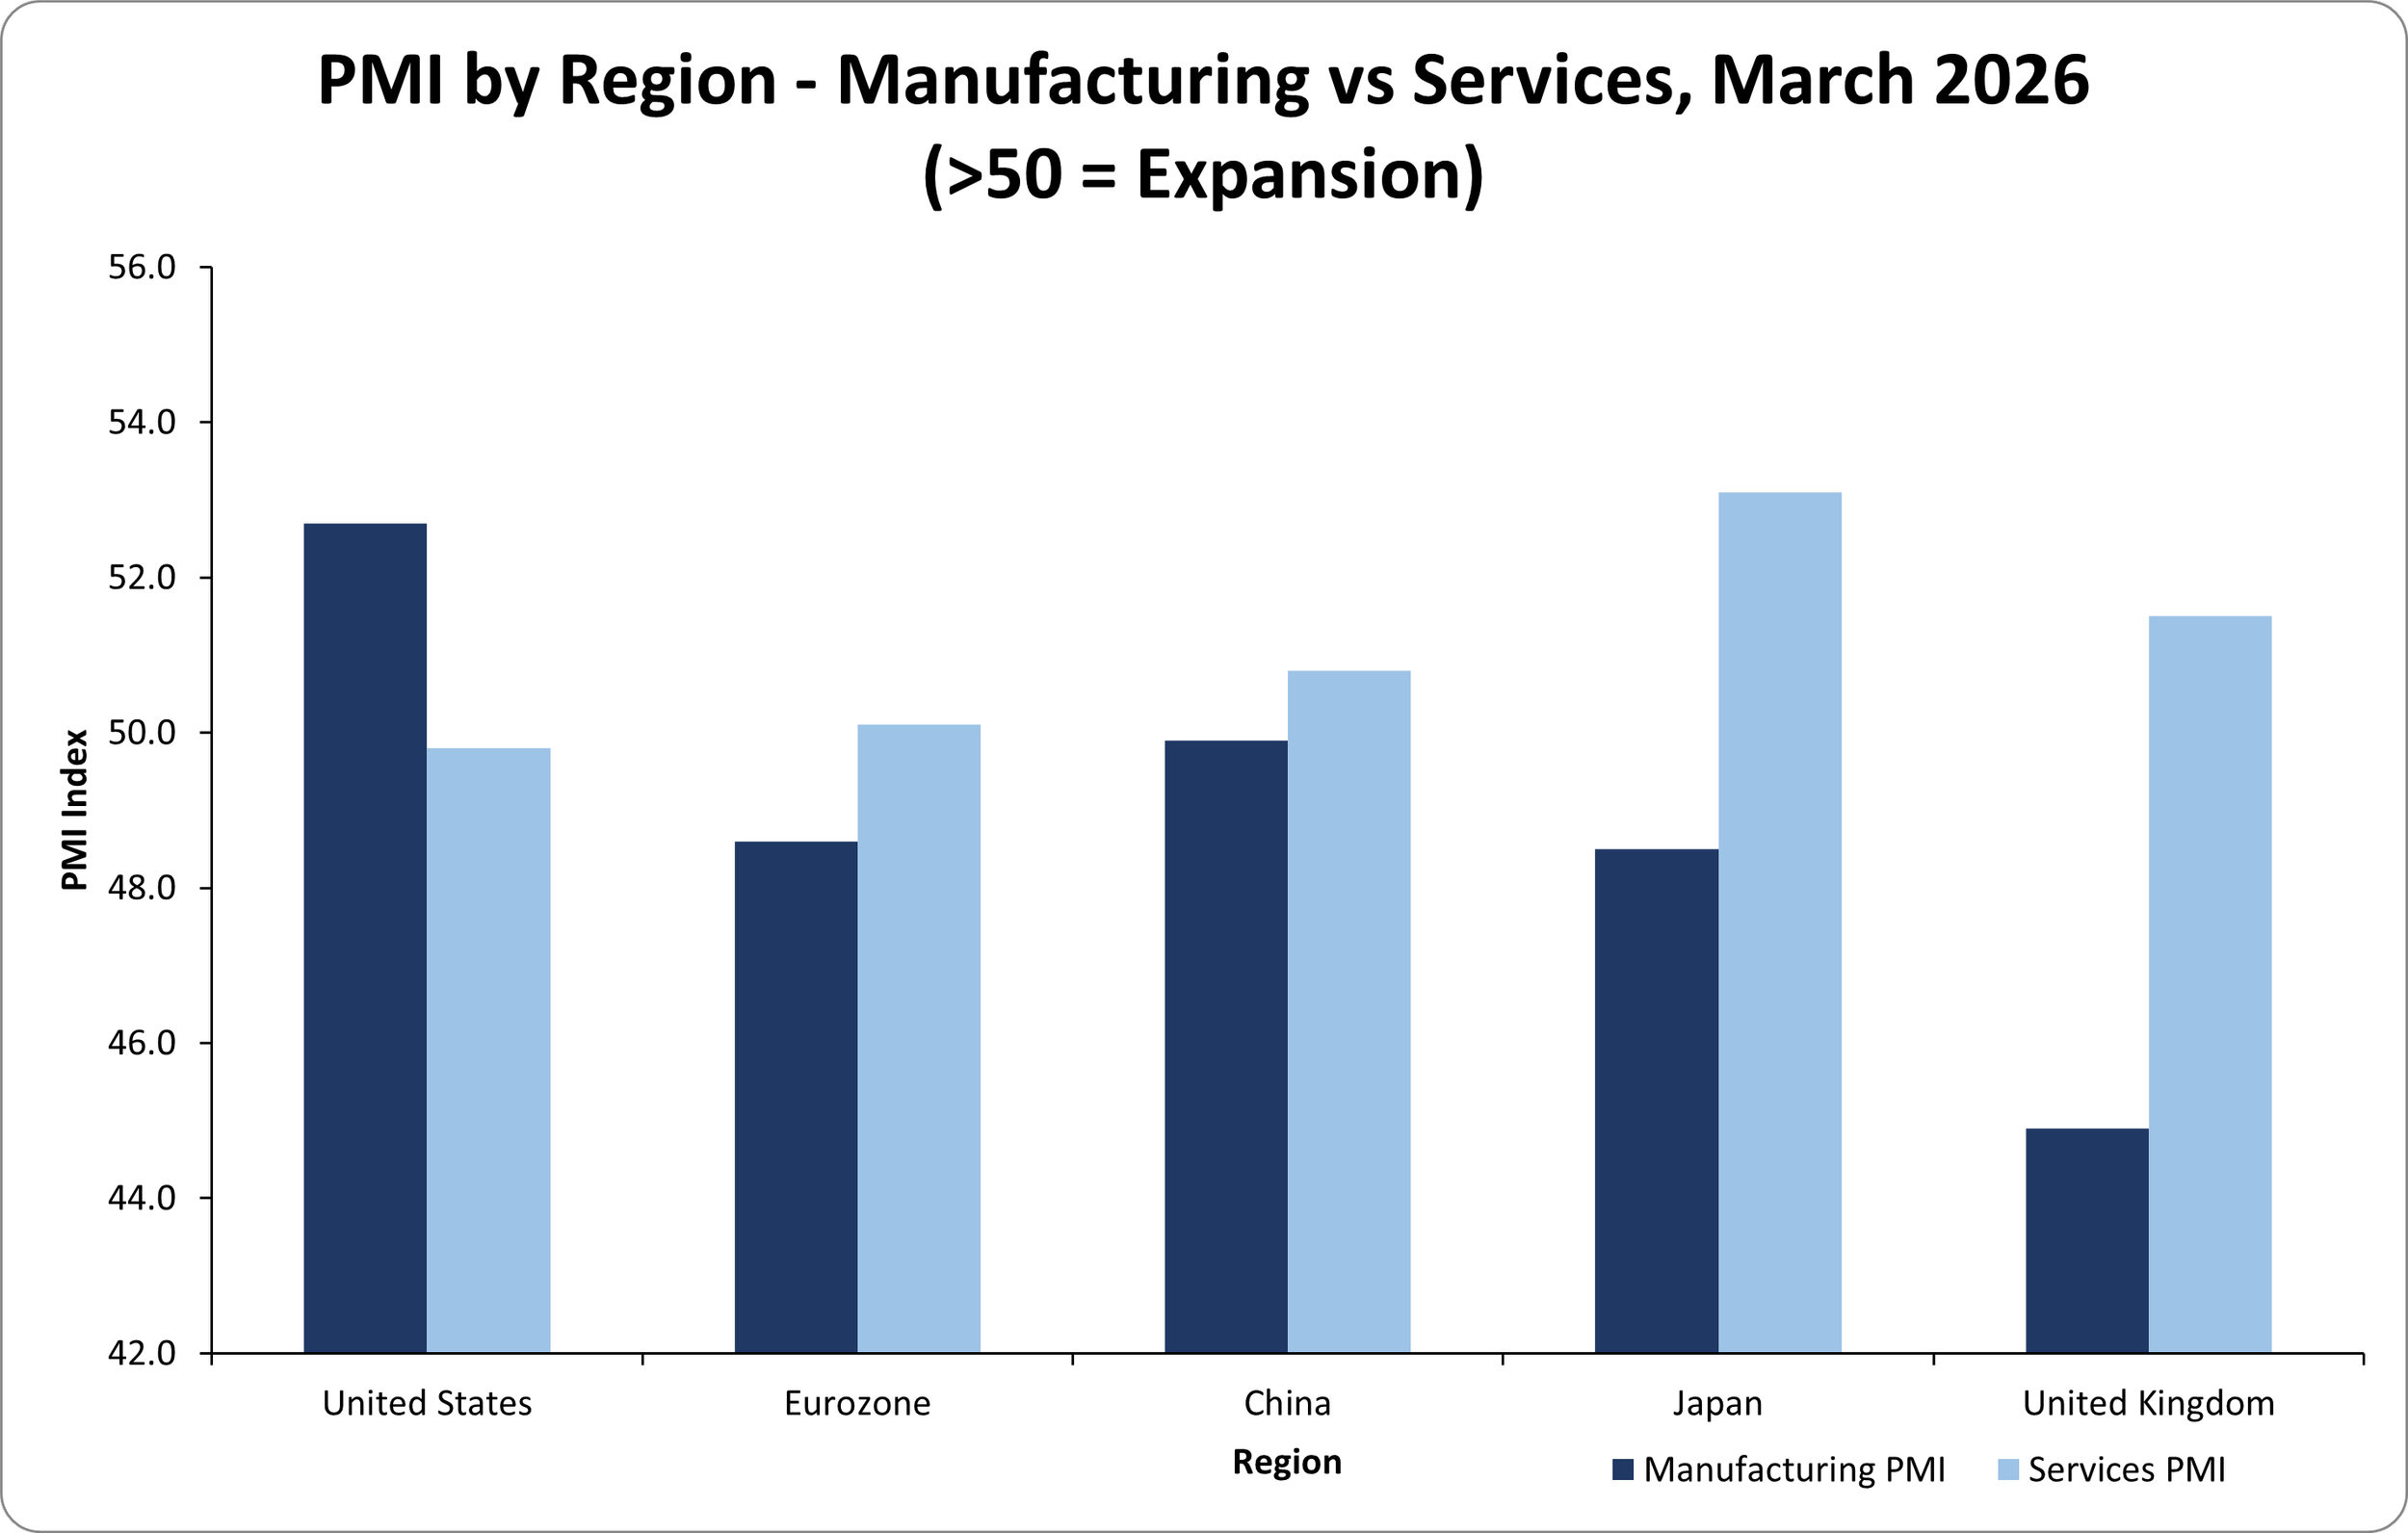
US manufacturing delivered one of its strongest headline readings in years even as the energy shock was unfolding. The ISM Manufacturing PMI registered 52.7% in March, up from 52.4% in February, the third consecutive month of expansion and the strongest pace since August 2022. Production accelerated to 55.1 from 53.5. The ISM Prices Paid subindex surged to 78.3, the highest since June 2022, driven by fuel cost escalation, supplier delivery disruptions, and residual tariff pressures. The Supplier Deliveries Index reached 58.9, indicating the slowest supplier delivery performance in nearly two years. Export orders returned to contraction at 49.9%, falling from 50.3 in February, as the global demand environment deteriorated in the second half of the month.
March was the first ISM report in which panelists explicitly cited the Iran war as a new factor affecting their businesses. Of all negative comments in the survey, 40% referenced the Middle East conflict and 20% referenced tariff uncertainty. That qualitative deterioration foreshadows what is likely to appear in April and May data as energy costs work through supply chains and business investment planning becomes more cautious.
The labor market data released during March showed underlying resilience before the conflict's economic consequences filtered through. Nonfarm payrolls rose 178,000 in March, well above the consensus estimate of 60,000 and reversing the 133,000 decline in February, which had been distorted by a healthcare workers' strike. The unemployment rate edged lower to 4.3%. Average hourly earnings rose just 0.2% for the month and 3.5% year-on-year, the lowest annual pace since May 2021. Initial jobless claims declined to 202,000 in the week ending March 28, their lowest level since late 2024. Retail sales in February rose 0.6% and increased 3.7% year-on-year. The University of Michigan's March consumer sentiment survey slipped, with respondents citing concerns about energy prices, and 1-year inflation expectations rose sharply, reflecting the immediate impact of higher gasoline costs on household psychology.
Europe
The Eurozone composite PMI deteriorated progressively as March advanced. Germany continued to register marginal expansion but at its weakest year-to-date pace. France and Italy both recorded contractions in services business activity, reversing the improvement seen in January and February. New business intakes declined across the eurozone, with renewed falls in sales volumes reflecting tighter consumer conditions as energy price inflation squeezed household budgets. Manufacturing input prices rose at their fastest rate since October 2022. New export orders continued to deteriorate, and supplier delivery times lengthened as Middle Eastern shipping disruption rippled across global logistics networks. European manufacturing had been showing encouraging signs of stabilization before the conflict. That tentative recovery has been set back by the energy shock, which affects European manufacturers both through direct cost pressures and through weaker final demand from consumers whose budgets are absorbing higher fuel costs.
Asia
Japan's manufacturing PMI continued below the 50 threshold at 48.5 in March, while the services sector held at 53.1, reflecting the continuing pattern of domestic service economy resilience contrasting with industrial weakness. Japan's manufacturing vulnerability to the energy shock was acute, given the country's near-complete dependence on imported energy and heavy reliance on Middle Eastern LNG and crude. The government began signaling strategic petroleum reserve releases and demand management measures in the second half of the month. Services expansion was supported by ongoing household spending in tourism, hospitality, and personal services, driven by the ongoing wage-driven consumption recovery.
China's official manufacturing PMI slipped below 50 to 49.9 in March from 50.2 in February. The weakening reflected both continued property sector drag and logistical disruption from Middle Eastern supply chain dependencies. Services PMI remained above 50 at 50.8, supported by targeted fiscal stimulus and ongoing infrastructure investment. India remained a standout performer, with both manufacturing and services PMIs comfortably above 50, reflecting robust domestic demand and infrastructure-driven investment. Southeast Asian economies showed resilience in services but saw manufacturing activity soften in the second half of March as disrupted shipping routes and weaker global demand created headwinds for export-oriented industries.
OECD Revisions and the Broader Growth Picture
The OECD published its Interim Economic Outlook during March with significant revisions. Global GDP growth projections for 2026 were maintained at approximately 2.9%, but G20 inflation was revised 1.2 percentage points higher to 4.0%, reflecting the energy shock flowing through to consumer prices. The OECD explicitly flagged that prolonged disruptions to Strait of Hormuz shipping or sustained energy infrastructure damage could lower global GDP by around 0.5% in the second year of the shock, with consumer prices higher by nearly 1 percentage point above the revised baseline. Even a less severe prolonged scenario would be sufficient to tip low-growth economies including Germany, Japan, and the UK into technical recession. The wide dispersion of these possible outcomes explains much of the elevated volatility observed across asset classes throughout the month.
-
United States ISM Manufacturing PMI
https://www.ismworld.org/supply-management-news-and-reports/reports/ism-report-on-business/
Trading Economics – United States Manufacturing PMI
https://tradingeconomics.com/united-states/manufacturing-pmi
Trading Economics – Euro Area Manufacturing PMI
https://tradingeconomics.com/euro-area/manufacturing-pmi
Trading Economics – China Manufacturing PMI
https://tradingeconomics.com/china/manufacturing-pmi
Trading Economics – Japan Manufacturing PMI
https://tradingeconomics.com/japan/manufacturing-pmi
S&P Global PMI Releases
https://www.pmi.spglobal.com/Public/Home/PressRelease
National Bureau of Statistics of China
Equity Markets
March 2026 will be studied as a textbook example of correlated de-risking. In most market stress episodes, diversification across styles, market caps, or geographies provides meaningful partial protection. In March, growth and value declined together. Large caps and small caps both fell sharply in absolute terms. European equities initially showed relative resilience but were dragged lower in the second half of the month as the energy shock's impact on import costs became fully priced. The near-universal character of the selloff reflected the specific nature of the shock: an energy-driven inflation surge simultaneously compresses corporate margins through higher input costs, reduces household purchasing power, raises the floor for interest rates, and creates geopolitical uncertainty across supply chains and trade routes. There is no sector that benefits uniformly from all four of those dynamics.
US Equity Performance
The S&P 500 declined approximately 5.8% in March, with losses concentrated in the second half of the month as Brent crude breached 100 dollars per barrel. The Nasdaq Composite fell 5.4%, while the Russell 2000 declined 7.2%, consistent with small-cap underperformance in environments where financing costs and consumer spending uncertainty rise simultaneously and where smaller companies have less balance sheet flexibility to absorb input cost shocks. The month began with constructive momentum. As of the start of March, the S&P 500 Equal Weight Index was sitting at all-time highs and market breadth had been improving. By mid-March, all eleven S&P 500 sectors were in negative territory for the month.
Technology performed better relative to the broader market than many observers expected given its traditional sensitivity to rising interest rates. This reflected a structural shift in how investors are treating large-cap AI-linked companies. The earnings bases of the largest AI infrastructure and platform names are now large enough, and their balance sheets strong enough, that they are increasingly regarded as defensive earnings assets rather than pure-duration rate-sensitive growth plays. The continued concentration of S&P 500 market cap in a handful of mega-cap technology companies provided partial protection to the cap-weighted index even as the median constituent experienced more severe declines.
S&P 500 forward earnings estimates of approximately 305 dollars per share for 2026 were already being revised lower in March as analysts applied energy cost haircuts to margin assumptions in transportation, airlines, consumer discretionary, and the broader industrials complex. The Shiller CAPE ratio, which entered 2026 above 40 for only the second time in its 155-year history, stood near 38.93 in March, still more than double the long-term historical average of approximately 17. The pace and depth of earnings revisions will be a primary driver of equity market direction through Q2.
International Equity Markets
European equities showed genuine resilience in the early days of March, benefiting from structural improvements in the fiscal outlook, ECB prior easing, and growing defense sector momentum. The STOXX Europe 600 finished down approximately 4.1% for the month, somewhat better than US benchmarks. European defense and aerospace names provided consistent partial support as Middle Eastern escalation renewed attention on NATO spending commitments. Metals and mining companies outperformed in the final week following reports of Iranian strikes on aluminum facilities in Bahrain and the UAE, which caused aluminum prices to surge sharply.
Japanese equities fell approximately 6.3% as measured by the Nikkei 225. The yen's modest depreciation in the early weeks of the conflict partially cushioned USD-denominated returns but did not offset the underlying headwind from Japan's acute energy import cost exposure. Chinese equities showed notable resilience, with the Shanghai Composite declining only 2.9% for the month. This reflected the Chinese government's rapid deployment of strategic petroleum reserve releases, which dampened the immediate corporate earnings impact, and the fact that China's equity market had already been underperforming global peers through much of 2025, meaning less speculative positioning to unwind. The MSCI EM index declined 4.8%, with commodity-exporting nations partially offsetting oil-importing economies.
-
S&P 500 Historical Data
https://finance.yahoo.com/quote/%5EGSPC/history
Nasdaq Composite Historical Data
https://finance.yahoo.com/quote/%5EIXIC/history
STOXX Europe 600
https://finance.yahoo.com/quote/%5ESTOXX
Nikkei 225
https://finance.yahoo.com/quote/%5EN225/history
Shanghai Composite
https://finance.yahoo.com/quote/000001.SS/history
VIX Index
Fixed Income and Credit
February's memo discussed a yield curve environment characterized by modest bull flattening as growth expectations softened and bond markets began to price the end of the tightening cycle. March reversed that dynamic almost entirely. The combination of an energy-driven inflation shock, a Fed that held rates and upgraded its inflation forecast, and a supply shock that introduces genuine uncertainty about 2026 growth and policy drove a bear steepening of the US Treasury curve. Shorter-duration yields rose as rate cut expectations were pushed out, and longer-duration yields rose even more as the term premium widened to reflect inflation uncertainty.
US Treasury Market
The US Treasury market began March with the 10-year yield at 3.96%, near its lowest level since before the November 2025 Fed meeting. By March 6, the conflict was already pushing yields higher, with the 10-year finishing at 4.15%. Following the FOMC meeting on March 18, where the Fed's upgraded inflation forecast and hawkish dot plot signaled higher-for-longer policy, the 10-year yield moved to 4.36%. By March 27, it had reached 4.44%, its highest level since July 2025. The 2-year yield also rose, from 3.56% at the start of the month to 3.88% by March 27, though it rose less than the 10-year, producing the steepening dynamic. The 30-year yield rose from approximately 4.30% at end-February to 4.98% by late March. The municipal bond market experienced its worst March performance since 2022, declining 2.5% for the month.
For the student of markets, this episode is instructive. It demonstrates that fixed income is not inherently defensive in an environment where inflation is the source of stress rather than growth. In a growth shock, bonds rally as safe havens. In an inflation shock, particularly one driven by supply constraints that the central bank cannot directly address, bonds fall alongside equities. The only instrument that truly hedged March's shock was crude oil itself.
Credit Markets
Credit markets showed greater resilience relative to equities and rates, reflecting the quality of corporate balance sheets rather than complacency. Investment-grade spreads widened modestly, moving from near cycle lows at the start of March to levels approximately 20 to 30 basis points wider by month-end. High-yield spreads widened more but remained below levels historically associated with systemic stress. The most significant widening was concentrated in transportation, airlines, and consumer discretionary sectors, where the direct impact of higher energy costs on operating margins was most pronounced. The investment-grade primary market slowed materially in the second half of March as issuers paused ahead of clearer geopolitical visibility, but the market did not close entirely.
The high-yield market remained bifurcated. Energy-related high-yield names experienced significant spread tightening, as higher oil prices improve the credit profiles of leveraged oil and gas producers. Non-energy cyclicals and consumer-facing credits faced spread widening as the demand destruction implications of higher energy costs were priced. This sectoral divergence within high yield is consistent with the energy shock's asymmetric impact: it benefits producers and hurts consumers and industrial users.
Emerging market debt experienced meaningful stress, particularly in oil-importing economies. Asian EM sovereign spreads widened as energy import costs rose, currencies weakened, and monetary policy flexibility was constrained. By contrast, Gulf sovereign bonds tightened sharply as fiscal revenues surged with higher crude prices, representing one of the cleanest expressions of the energy shock's distributional consequences across global credit markets.
What the Yield Move Means for Investors
The bear steepening of March 2026 creates a challenging environment for duration investors. Investors who had extended duration in February in anticipation of Fed cuts have seen those positions mark significantly lower. The optimal positioning in the current environment, as articulated by several major asset managers, is to remain neutral on duration, favor the belly of the curve where carry is attractive without maximum duration risk, and to focus on investment-grade corporate bonds over Treasuries for income generation. The carry-to-duration tradeoff in short-to-intermediate corporate credit is more attractive than in long-dated government bonds given the current yield curve shape.
-
US 2 Year Treasury Yield (DGS2)
https://fred.stlouisfed.org/series/DGS2
US 10 Year Treasury Yield (DGS10)
https://fred.stlouisfed.org/series/DGS10
US Investment Grade Corporate Spread (ICE BofA OAS) https://fred.stlouisfed.org/series/BAMLCOA0CM
US High Yield Corporate Spread (ICE BofA OAS) https://fred.stlouisfed.org/series/BAMLH0AOHYM2
Canada 10 Year Government Bond Yield
https://fred.stlouisfed.org/series/IRLTLT01CAM156N
Euro Area 10 Year Government Bond Yield
Commodities & Alternatives
No section of this memorandum can be written without reference to the oil market, because March 2026's commodity story is, in its entirety, the story of what happens when 20% of global oil supply is removed from the market in the space of two weeks. The IEA described the Strait of Hormuz closure as generating the largest supply disruption in the history of the global oil market, explicitly surpassing the 1973 Arab oil embargo in the volume of barrels removed from daily circulation. Whether March 2026 follows a similar macroeconomic path to 1973 depends entirely on how quickly Strait of Hormuz traffic can resume and how rapidly Gulf producers can restart shut-in production.
Crude Oil: Anatomy of a Price Shock
Brent crude opened 2026 at 61 dollars per barrel. Through January and February, prices rose gradually in response to building geopolitical risk premiums as tensions escalated. By the end of February, Brent had moved to approximately 72 dollars per barrel, already incorporating a roughly 18-dollar geopolitical premium per barrel. When the air strikes began on February 28 and tanker traffic through the Strait stopped, the price mechanism responded immediately. Brent surpassed 100 dollars on March 12 and reached nearly 120 dollars by the final week of the month. Spot Brent for near-term cargo delivery touched 124.68 dollars per barrel in early April even after the ceasefire announcement, demonstrating that physical scarcity persists even as futures markets reflect ceasefire optimism. The Brent-WTI spread widened sharply as WTI, less dependent on Hormuz-route tankers given strong US domestic production, underperformed Brent to the upside.
The mechanics of the shock involved three reinforcing drivers. First, approximately 20 million barrels per day of crude and refined product exports that normally transit the Strait effectively ceased, with producers shutting in production as storage tanks filled. Iraq shut in major fields including Rumaila. Saudi Arabia, the UAE, Kuwait, and Qatar reduced output. The IEA estimated Gulf countries collectively cut production by at least 10 million barrels per day. Second, the risk of vessel damage from Iranian attacks raised insurance costs to prohibitive levels and prevented even willing tanker owners from dispatching ships. Third, major global consumers including the US, China, Japan, and European nations began drawing down strategic petroleum reserves to cushion immediate supply shortfalls. The EIA raised its average 2026 Brent crude forecast to 96 dollars per barrel from the pre-conflict estimate of 78.84 dollars. Goldman Sachs noted that if Hormuz remained essentially closed for another month, Brent could average above 100 dollars for the full year 2026.
The Hormuz closure also disrupted global LNG markets significantly. Qatar, the world's largest LNG exporter, was forced to curtail exports as tankers could not safely load. Europe and Asia, both large importers of Qatari LNG, faced an immediate tightening in gas supply. European natural gas prices surged as the scale of the supply disruption became clear. European storage levels, comfortably above five-year averages entering 2026, began drawing faster than seasonal norms. Asian spot LNG prices rose sharply as regional importers competed for cargoes from alternative supply sources including the US, Australia, and West Africa. Henry Hub natural gas in the US remained more stable, reflecting domestic production insulation, while higher US LNG export demand supported a modest increase in domestic prices.
Industrial metals experienced significant volatility in the second half of March. Iranian strikes on aluminum smelting facilities in Bahrain and the UAE threatened a supply disruption that had not been anticipated in the initial conflict pricing. Aluminum prices surged sharply. Copper also moved higher, reflecting both direct Middle Eastern supply chain disruptions and the indirect inflation channel through higher transportation costs for all globally traded commodities. Copper and aluminum are no longer purely driven by traditional construction and manufacturing cycles. They are embedded in energy transition supply chains, data center infrastructure, and renewable energy systems with long-duration demand that is structurally independent of the cyclical slowdown, and that demand floor limited the downside in industrial metals even as broader risk sentiment deteriorated.
Gold's performance in March was the most analytically striking development in the commodities complex. Gold declined 11.6% for the month and silver fell 19.9%. Historically, gold has functioned as a safe haven during geopolitical crises. March 2026 was a clear exception. The breakdown reflected two dynamics operating simultaneously. First, the 5-year forward breakeven rate actually fell toward the lows seen during the prior year's tariff uncertainty, suggesting that markets were not pricing persistent long-term inflation from the energy shock but rather viewing it as transitory. With real yields rising rather than falling, the opportunity cost of holding gold increased. Second, investors in March were liquidating assets broadly to meet margin requirements and reduce risk exposures. In this environment, gold's liquidity made it attractive as a source of cash, leading to selling pressure that overwhelmed traditional safe-haven demand. The pattern is not unprecedented: gold also sold off in the early stages of the March 2020 COVID crisis before recovering as a strong performer in the subsequent phase.
Agricultural commodity markets were largely secondary in March's narrative but experienced specific disruptions. Fertilizer prices rose sharply as ammonia and phosphate supply chains from the Middle East and Gulf region were disrupted. Higher input costs for fertilizers will take several months to flow through into crop production costs and eventually food prices, but agricultural analysts flagged this as a developing secondary inflation channel. Grain markets were more stable, supported by adequate global inventories and Northern Hemisphere planting season dynamics. The immediate food price impact in March was limited to animal feed cost increases and logistics cost escalation through higher shipping costs.
Private credit markets remained broadly stable in March, reflecting the asset class's structural insulation from daily market volatility. However, investment activity slowed significantly as deal teams paused to assess the conflict's implications for leveraged buyout return assumptions, energy cost projections, and consumer demand trajectories. Infrastructure assets held their valuations better than public equities given long-term contracted revenue profiles, but renewable energy project economics were complicated by rising materials costs. Hedge funds posted a highly dispersed performance month, with macro and commodity-focused strategies generating strong returns while equity long-short and credit strategies faced more challenging conditions as correlations rose and the spread between winners and losers compressed.
-
WTI Crude Oil Prices
https://fred.stlouisfed.org/series/DCOILWTICO
Brent Crude Oil Prices
https://fred.stlouisfed.org/series/DCOILBRENTEU
Gold Price (London Bullion Market, USD) https://fred.stlouisfed.org/series/GOLDAMGBD228NLBM
Copper Prices
https://fred.stlouisfed.org/series/PCOPPUSDM
Natural Gas Prices (Henry Hub)
https://fred.stlouisfed.org/series/DHHNGSP
S&P GSCI Commodity Index
Key Themes of the Month
Theme 1: The Energy Shock and Stagflation Conversation
Why March Raises the Stagflation Risk
The word stagflation became the defining economic concept of the 1970s, re-entered the mainstream policy discourse in March 2026 for the first time in the current cycle. The combination of a supply-driven inflation spike and a simultaneous deterioration in growth indicators is, mechanically, the definition of a stagflationary shock. The more important analytical question is not whether the shock has occurred but whether its effects will be temporary and self-limiting, as the ceasefire scenario implies, or durable and self-reinforcing, as a prolonged Hormuz disruption would produce.
The evidence from March supports a temporary characterization on the demand-side inflation metrics. Core CPI held at 2.6%, services inflation remained around 3.0%, wages rose at their slowest pace since 2021, and consumer spending data through mid-March remained solid. These are not the readings of an economy where inflation has become embedded in wage and price expectations. They are the readings of an economy that has been hit by an external cost shock that has not yet fed into the wage-price dynamic. The critical determinant of whether March becomes 1973 or a managed episode is the duration of the Strait of Hormuz disruption and the pace at which Gulf production can be restored following the ceasefire.
The secondary transmission channels are where the stagflation risk is most real. Fertilizer prices rising sharply will affect food costs in Q2 and Q3. Shipping and logistics cost escalation will filter into goods prices over the following two to three months. Airlines and transportation companies are already raising fares. If those secondary channels coincide with a softening labor market, the Fed faces a genuinely difficult tradeoff between supporting growth through rate cuts and containing inflation through restraint. March's data does not yet force that choice, but April and May could.
What This Means for Markets
For equity markets, the stagflation risk scenario is the most challenging possible environment because there is no asset class that benefits from simultaneous growth deterioration and inflation persistence. Duration investors face continued pressure as yields stay elevated. Equity investors face margin compression from higher input costs without the demand growth to compensate. Credit investors face widening spreads as default risk rises. The partial exception is energy, real assets, and commodity-linked equities, which benefit directly from higher commodity prices. The natural hedge in a stagflation environment is concentration in companies with genuine pricing power, low input cost exposure, and revenue streams tied directly to the commodity complex. Defense spending remains a structural positive regardless of the inflationary environment, as government procurement is not price-sensitive in the short run.
-
US 2 Year Treasury Yield (FRED)
https://fred.stlouisfed.org/series/DGS2
US 10 Year Treasury Yield (FRED)
https://fred.stlouisfed.org/series/DGS10
US Treasury Auction Results
https://www.treasurydirect.gov/auctions/announcements-data-results/
Japan 10 Year Government Bond Yield (FRED)
https://fred.stlouisfed.org/series/IRLTLT01JPM156N
Euro Area 10 Year Government Bond Yield (FRED)
https://fred.stlouisfed.org/series/IRLTLT01EZM156N
Federal Reserve FOMC Statements
https://www.federalreserve.gov/monetarypolicy/fomccalendars.htm
Bank of Japan Monetary Policy Statements
The Crumbling Safe Haven: Why Gold Sold Off
The Mechanics of the Reversal
Gold's 11.6% decline in March was analytically significant beyond its magnitude because it violated one of the most reliably observed patterns in global financial markets: that gold rallies during geopolitical crises. The selloff demands explanation because the breakdown of this pattern has important implications for portfolio construction and risk management going forward.
The mechanism was a combination of real yield dynamics and forced liquidation. Gold's valuation is driven primarily by real yields, which are nominal yields minus inflation expectations. In a scenario where the 5-year forward breakeven rate falls while nominal yields rise, real yields increase and the opportunity cost of holding a non-yielding asset like gold rises sharply. That is precisely what happened in March. Markets priced the energy shock as transitory rather than structural, keeping long-run inflation expectations contained even as near-term energy prices surged. The result was rising nominal yields with contained forward inflation expectations, producing the worst possible real yield environment for gold.
The forced liquidation element compounded this. In an extremely fast-moving market environment, gold's deep liquidity makes it an attractive source of cash for investors who need to meet margin requirements, reduce leverage, or reduce overall risk exposure quickly. The same pattern was visible in March 2020 and in the peak of the 2008 financial crisis. In both cases, gold sold off sharply in the initial phase before recovering strongly once the forced liquidation cycle was complete and investors began rebuilding defensive positions. The analytical question for April is whether gold is approaching that recovery phase, particularly as the ceasefire reduces the urgency of forced de-risking and as the real yield picture may stabilize or reverse if the Fed signals more patience on policy normalization.
What This Means for Markets
The gold selloff reinforces that portfolio hedging in an energy-shock scenario requires direct exposure to the energy complex rather than reliance on traditional safe havens. For institutional investors, this means oil futures, energy equity sector exposure, and commodity-linked real assets provide more reliable protection in a supply-shock environment than gold, TIPS, or investment-grade bonds. The gold recovery trade is worth monitoring closely as the ceasefire dynamic evolves, but it should be sized as an opportunistic position rather than a core defensive allocation while real yields remain elevated.
-
S&P 500 Historical Data (Yahoo Finance) https://finance.yahoo.com/quote/%5EGSPC/history
Nasdaq Composite Historical Data (Yahoo Finance) https://finance.yahoo.com/quote/%5EIXIC/history
STOXX Europe 600 (Yahoo Finance) https://finance.yahoo.com/quote/%5ESTOXX/history
Nikkei 225 (Yahoo Finance)
https://finance.yahoo.com/quote/%5EN225/history
Shanghai Composite (Yahoo Finance) https://finance.yahoo.com/quote/000001.SS/history
CBOE VIX Index (Yahoo Finance)
https://finance.yahoo.com/quote/%5EVIX/history
Global ETF Fund Flows (ETF.com)
https://www.etf.com/etfanalytics/etf-fund-flows-tool
IMF Capital Flows Database
https://data.imf.org/?sk=E3F5F871-EC85-4E24-8EFB-8D3FBD92B5B1
The Credibility Question: Central Banks Under Pressure
The Policy Communication Problem
The Federal Reserve's credibility as an inflation-fighting institution faces a novel test in March 2026 that is structurally different from the challenges of 2022. In 2022, the Fed's credibility question was whether it would act aggressively enough to contain demand-driven inflation. The answer was yes, and the hiking cycle that followed was one of the most aggressive in modern Fed history. In March 2026, the credibility question is more subtle: can the Fed maintain a credible inflation-fighting stance while simultaneously avoiding a recession caused by a supply shock it has no instrument to address?
The institutional complexity is compounded by the impending leadership transition. Chair Powell's term ends in May, and the anticipated appointment of Kevin Warsh, who is expected to favor lower rates, has begun to influence market expectations before the transition has even occurred. If market participants begin to price a more accommodative Fed in advance of the actual transition, inflation expectations could become unanchored in a self-fulfilling dynamic that forces the new chair to tighten more aggressively than intended. The political pressure from the Trump administration's public commentary on monetary policy adds another layer of complexity that has no clean historical precedent in the current inflationary environment.
The ECB faces a different but equally challenging credibility problem. Having delivered eight rate cuts since mid-2024 and lowered the deposit rate to 2.0%, the ECB now finds itself in a position where futures markets are partly pricing rate hikes in response to an energy shock that may prove transitory. Reversing that expectation without appearing to abandon its inflation target would require careful communication and, critically, evidence from April and May data that the energy shock is not producing lasting second-round wage effects.
What This Means for Markets
Central bank credibility cncerns translate directly into higher risk premiums across asset classes, particularly in duration-sensitive instruments. If markets begin to doubt that the Fed will hold firm against inflation during a leadership transition, or that the ECB will resist political pressure to ease in the face of weak growth, the consequence is wider credit spreads, higher term premiums on government bonds, and lower equity multiples across the board. The most constructive scenario for markets is one where the ceasefire holds, energy prices moderate quickly, core inflation remains contained through April and May, and both the Fed and ECB are able to resume their measured easing paths with their credibility intact. That scenario is plausible given the current core data, but it depends on geopolitical developments that remain highly uncertain.
-
US Investment Grade OAS (FRED)
https://fred.stlouisfed.org/series/BAMLC0A0CM
US High Yield OAS (FRED)
https://fred.stlouisfed.org/series/BAMLH0A0HYM2
Corporate Bond Yields (FRED)
https://fred.stlouisfed.org/series/BAA10Y
Moody's Default Rate Data
https://www.moodys.com/researchandratings/market-segment/corporate/credit-risk
S&P Global Default Statistics
https://www.spglobal.com/ratings/en/research-insights/special-reports/default-transition
Private Credit Market Data (Preqin)
https://www.preqin.com/insights
US Commercial Bank Lending Standards (FRED)
What to Watch For Next Month
April will be defined by whether the ceasefire holds and what the incoming macro data reveals about March's economic damage. The most critical variable is the pace at which Strait of Hormuz traffic resumes and Gulf producers restart shut-in production. A durable resumption of flows would allow energy prices to moderate toward the 90 to 95 dollar Brent range that futures markets are currently pricing for Q2, which would support a gradual easing of headline CPI back toward core levels. A fragile or failed ceasefire would extend the supply shock and push the stagflation scenario from a tail risk into a base case.
The April 10 CPI release, which will capture March's full energy surge, has already been published and came in at 3.3% as discussed. The more important release is the May CPI, which will reveal whether April's data shows secondary transmission from energy into goods and services prices. Shelter and services inflation, which have been the Fed's primary indicators of demand-side persistence throughout this cycle, are the subcomponents to watch most closely. A continuation of the 3.0% annual services reading would give the Fed room to look through the headline surge. An acceleration toward 3.5% or above would change the calculus materially.
Labor market data will provide the second major input into the Fed's thinking. March payrolls surprised to the upside at 178,000, but the February revision to -133,000 reflects genuine underlying weakness. The April employment report will indicate whether the services sector employment contraction seen in the ISM data is spreading into the broader labor market. Average hourly earnings growth, currently at 3.5% year-on-year, is the key figure. Any acceleration above 4.0% would raise concerns about wage-price dynamics re-emerging.
Corporate earnings season for Q1 2026, which begins in earnest in mid-April, will translate March's macro disruption into company-level financial impacts. Energy and defense sector earnings will be strong. Airlines, transportation, consumer discretionary, and industrials will face margin pressure questions. Technology mega-caps will need to demonstrate that their AI infrastructure earnings outlooks remain intact despite the broader macro uncertainty. Management guidance for Q2 and full-year 2026 will be more important than the backward-looking Q1 numbers, as investors are attempting to assess whether the energy shock's demand destruction effects will require meaningful earnings estimate reductions.
The Federal Reserve's leadership transition deserves specific attention as Powell's May departure approaches. Any signals from the administration about the timeline and conditions under which Warsh will be confirmed, and any public statements from Warsh himself about his policy views, will be closely watched by fixed income markets. A more dovish Fed chair arriving into a still-elevated inflation environment creates a novel policy communications challenge. Credit markets, which remained relatively stable in March, will be a leading indicator of whether investors begin to price a credibility concern.
Finally, geopolitical developments in the Middle East beyond the ceasefire dynamic remain central. The two-week ceasefire between the US and Iran established a tenuous framework, but the underlying conditions that produced the conflict, including Iranian nuclear program concerns, Israeli security priorities, and the status of Hormuz navigation rights, have not been resolved. Any news of ceasefire breakdown, new sanctions, or escalation involving third parties including Saudi Arabia, the UAE, or Israel will immediately translate into energy price and risk premium movements. The relationship between geopolitical headlines and financial market volatility, which was extreme in March, will remain elevated through Q2.
Closing Remarks
March 2026 closed with markets in a state of genuine uncertainty that had not been present since the 2022 energy shock. The Strait of Hormuz closure, the largest oil supply disruption in recorded history, forced a comprehensive repricing of inflation expectations, central bank policy paths, corporate earnings prospects, and geopolitical risk premiums across every asset class simultaneously. The compression of the diversification benefit, the breakdown of gold's safe-haven function, and the correlated de-risking across growth and value equities together reflect an environment where a single macro variable, the price of energy, overwhelmed the differentiated fundamentals that normally drive cross-asset performance.
The most important analytical distinction to carry into April is between the headline shock and the underlying economic trajectory. Core CPI held at 2.6%. Services inflation remained around 3.0%. Wages grew at their slowest pace since 2021. Consumer spending was solid through mid-March. The labor market, despite the February weakness, showed genuine resilience in the March jobs report. These are not the readings of an economy that has lost its inflation-fighting momentum. They are the readings of an economy that has absorbed a large external cost shock without generating the secondary wage and services inflation that would transform a transitory episode into a sustained stagflationary regime.
The ceasefire announced at the start of April provides a constructive foundation for the thesis that March's shock was severe but potentially self-limiting. However, the physical realities of tanker rerouting, production restarts, and supply chain normalization mean that the energy price impact will persist well into Q2 even under the most optimistic diplomatic scenarios. The spot Brent premium of nearly 30 dollars above June futures captures this physical scarcity dynamic clearly: markets believe the ceasefire is real, but the barrels are not flowing yet.
For students of markets, March 2026 offers a compressed lesson in how geopolitics and macro interact. The month demonstrated that energy markets remain the primary transmission mechanism through which geopolitical events reach financial asset prices. It showed that traditional safe havens do not behave as expected in every crisis. It illustrated that fixed income can be a source of loss rather than protection when the nature of the shock is inflationary rather than deflationary. And it reinforced that the Fed's policy credibility, already tested by the institutional transition underway, is a variable that markets price actively rather than taking for granted.
The path into Q2 is navigable if the ceasefire holds and secondary inflation transmission remains contained. The risks are elevated, dispersed, and genuinely uncertain in a way that March made viscerally clear. Selectivity, pricing power, and direct energy exposure are the portfolio characteristics that matter most in this environment, and that framework is unlikely to change until clarity emerges on whether the geopolitical situation has stabilized or merely paused.