
Monthly Market Memorandum - November 2025
Contents
Executive Summary
Macro & Market Overview
2.1 Inflation & Rates
2.2 Global Economic Activity
2.3 Equity Markets
2.4 Fixed Income & Credit
2.5 Commodities & Alternatives
Key Themes of the Month
3.1 M&A Resurgence
3.2 AI & Tech Investments
3.3 Geopolitical Shifts & Global Risk
What to Watch Next Month
Closing Remarks
Executive Summary
Global markets ended November with a clear risk-on tone. The shift was mainly driven by ongoing signs of disinflation across major economies and a growing view that policy rates could start moving lower at some point in 2026. Equity performance reflected this change in expectations. The S&P 500 gained roughly 4.8% during the month, supported by continued strength in AI-related hardware names, defense technology suppliers, and firms tied to industrial automation. The NASDAQ outperformed with a gain close to 6% as lower real yields helped pull capital back toward growth-heavy sectors.
Credit markets tightened further. US high-yield spreads compressed by about 35 basis points and returned to levels last seen in mid-2021. Investment-grade primary activity was busy with approximately 145 billion dollars in issuance, which is high for a November calendar. Issuers appear to be front-loading funding while the window is constructive and while volatility stays subdued.
The friendlier financing conditions fed into corporate activity. Global M&A announcements came in near 380 billion dollars, which is more than a 25% increase from the prior month. Private equity firms were active and accounted for roughly one-third of total deal volume. Cross-border transactions improved as well. That trend seems tied to reduced concern around interest-rate divergence and a steadier US dollar.
Inflation data was mixed across the G7 but generally pointed in the right direction. Headline readings slowed, although services inflation remained sticky in both the United States and the Eurozone. US PCE inflation eased to 2.7% on a year-over-year basis. However, the non-housing services component stayed above 4%. That gap continues to complicate policy communication, which is why central bank officials have shifted away from language suggesting a quick easing cycle. Markets still expect roughly 75 to 100 basis points of Federal Reserve cuts by the end of 2026, but those expectations depend heavily on the path of services inflation through the first half of next year.
Energy markets did not react much to geopolitical tensions in Eastern Europe or the Middle East. Brent crude traded mostly between 79 and 84 dollars a barrel. Investors are waiting for clarification on possible OPEC+ production adjustments in early 2026. Long-duration assets performed better as the ten-year Treasury yield dropped about 22 basis points and finished November at roughly 4.25%.
Heading into December, attention will shift to central bank meetings, labor market conditions, and revisions to corporate earnings forecasts. These releases will determine whether the market’s easing narrative can hold or whether persistent services inflation forces a more cautious outlook on the timing of global rate cuts.
Sources:
Macro & Market Overview
Inflation & Rates
Disinflation continued to progress in November, though the underlying forces were not uniform across regions. In Europe, most of the improvement came from base effects in the energy complex, which pulled headline readings lower even as core categories stayed mixed. The United States and Canada saw a different setup. Shelter inflation lost some momentum and goods prices continued to soften, which helped bring overall measures closer to their respective targets. Japan’s trend also moved down, but inflation there is still above the BOJ’s comfort zone. That makes the path to policy normalization harder to map out, since wage dynamics and imported cost pressures have not settled into a stable pattern yet.
Monetary policy expectations shifted as these data came out. Investors delayed their timelines for the next steps from the ECB and became less confident that the BOJ is ready to enter its first sustained tightening cycle in a generation. At the same time, markets pulled forward the expected start of rate cuts from the Federal Reserve and the Bank of Canada. The adjustment in expectations was fairly quick, which suggests that investors are putting more weight on the recent rotation in core inflation components, especially services.
Heading into December, the macro backdrop looks consistent with slower global growth and fading inflation pressures. However, the rate outlook across major central banks is diverging more than it was earlier in the year, and that gap will likely drive cross-market positioning as investors reassess relative value between regions.
United States
The US CPI continued its downward trajectory, with headline inflation easing towards the mid 3% range, while core stabilizing in the high 3% range. As used-car prices continue to decline and supply chains full normalize, the disinflation of goods are accelerated.
Core services inflation, particularly in the shelter and “supercore” categories, remains persistently high even as overall inflation moderates. Shelter inflation is steady at a year-over-year rate of 3.6%, primarily due to the delayed impact of lower new rental rates and ongoing strength in mortgage costs.
Supercore services, which exclude shelter, have maintained an elevated annualized pace near 5%in recent months. This resilience reflects continued wage growth in consumer-oriented sectors; for example, hospitality wages have increased by 2.1% in 2025 and nearly 30% since 2019, with average hourly earnings reaching $22.70. Labor markets in healthcare and leisure also remain tight, supporting further payroll gains.
As businesses face rising labor costs, they are increasingly passing these on to consumers, resulting in sustained inflation in core services even as goods prices stabilize. This wage-driven stickiness in core services remains a significant barrier to faster progress in reducing overall inflation.
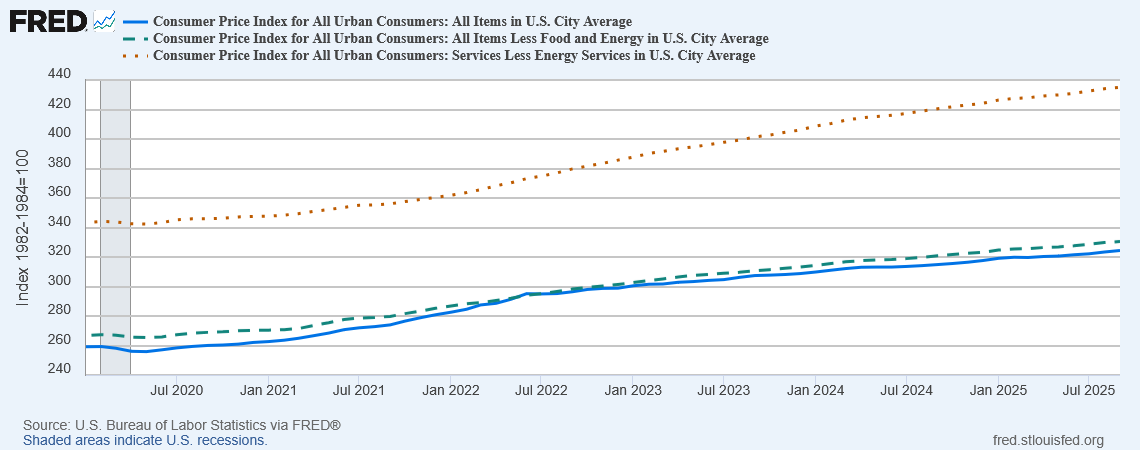
U.S. headline and core CPI have decelerated steadily through 2025, though shelter inflation remains elevated, reflecting ongoing wage pressures.
According to recent labor market reports, payrolls in the healthcare and leisure sectors consistently exceed the overall market, indicating that wage growth is still particularly robust in these sectors. The average hourly wage in the hospitality industry has risen to $22.70, prompting employers to increase service costs and maintain high rates of inflation in those sectors. These pressures are made worse by labor shortages and demographic challenges.
The methodological lag of the CPI still has an impact on shelter inflation. Although market rents have decreased throughout 2025, the CPI's survey-based methodology only gradually takes these developments into account. Because of this, shelter inflation in official statistics continues to be higher than current market trends, hiding underlying progress.
The policy environment that the Federal Reserve operates in is complicated. Market participants are pricing in a slower and more cautious path to rate cuts through 2026 as a result of the service economy's ongoing wage-driven inflation. Core services inflation will probably continue to be the main barrier to bringing headline inflation back to target until labor market pressures lessen.
Future Trajectory
Given the deeper structural pressures in the American economy, which are indicated by the continued persistence of core services inflation, costs continue to rise due to wage growth and labor shortages in vital service sectors like healthcare, hospitality, and leisure, which in turn are passed from companies to consumers.
Even though new rental markets are starting to slow down, shelter inflation is still high because of the delay in official measurements. The Federal Reserve's 2% inflation target is being slowed down by these factors, and core services are currently the main obstacle to price stability. Achieving sustained low inflation will continue to be a major challenge until labor markets in the service sector relax and wage pressures lessen.
-
BLS CPI Homepage
https://www.bls.gov/cpi/BLS CPI Detailed Report
https://www.bls.gov/opub/hom/cpi/home.htmFRED – CPI All Items
https://fred.stlouisfed.org/series/CPIAUCSL (CPIAUSCL)
https://fred.stlouisfed.org/series/CPILFESL (CPILFESL)
https://fred.stlouisfed.org/series/CUSR0000SASLE (CUSR0000SASLE)
TradingEconomics – U.S. Core Inflation Rate
https://tradingeconomics.com/united-states/core-inflation-rate
FRED – Sticky-Price Consumer Price Index
https://fred.stlouisfed.org/series/STICKCPIM157SFRBATL
Atlanta Fed – Sticky/ Flexible CPI Methodology
https://www.atlantafed.org/research/inflationproject/sticky-price-cpi
Wages (Hospitality, Leisure, Healthcare)
FRED – Average Hourly Earnings, Leisure & Hospitality (CES7000000003)
https://fred.stlouisfed.org/series/CES7000000003
BLS – Employment & Wages in Leisure/Hospitality
https://www.bls.gov/iag/tgs/iag70.htmOysterLink – 2025 Hospitality Wages ($22.70/hour figure)
https://oysterlink.com/salary/us/hospitality-wages-2025/
BLS – Employment Situation Summary
https://www.bls.gov/news.release/empsit.nr0.htm
FRED – Job Openings: JOLTS Total Nonfarm (JTSJOL)
https://fred.stlouisfed.org/series/JTSJOL
Federal Reserve FOMC Statement – October 29, 2025 (Policy Cut)
https://www.federalreserve.gov/newsevents/pressreleases/monetary20251029a.htm
Reuters – Jefferson says Fed must move slowly with further rate cuts
Reuters – Goolsbee uneasy about further cuts
Investopedia – Fed Officials Debate Future Cuts
https://www.cmegroup.com/markets/interest-rates/cme-fedwatch-tool.html
Other Supporting Data (Inflation Expectations, Wage Pressures)
NY Fed Survey of Consumer Expectations
https://www.newyorkfed.org/microeconomics/sce
Conference Board Wage Tracker
Canada
With the headline CPI settling in the mid-2% range and the Bank of Canada's Trim and Median core metrics gradually converging within the central bank's 1 to 3% target interval, Canada's inflation landscape saw a significant shift through 2025. This moderation is not uniform; in particular, regional variations in shelter inflation and the changing nature of consumer demand have influenced its pace. New rental data indicates a quicker return to affordable housing in non-metropolitan areas, but pressure is still high in the biggest cities. The rate of decline in urban shelter inflation is complicated by variables like mortgage rate resets and slow supply growth. This division is highlighted by monthly CPI reports, which show how aggregate price momentum is more susceptible to disinflation in housing costs outside of Toronto and Vancouver.
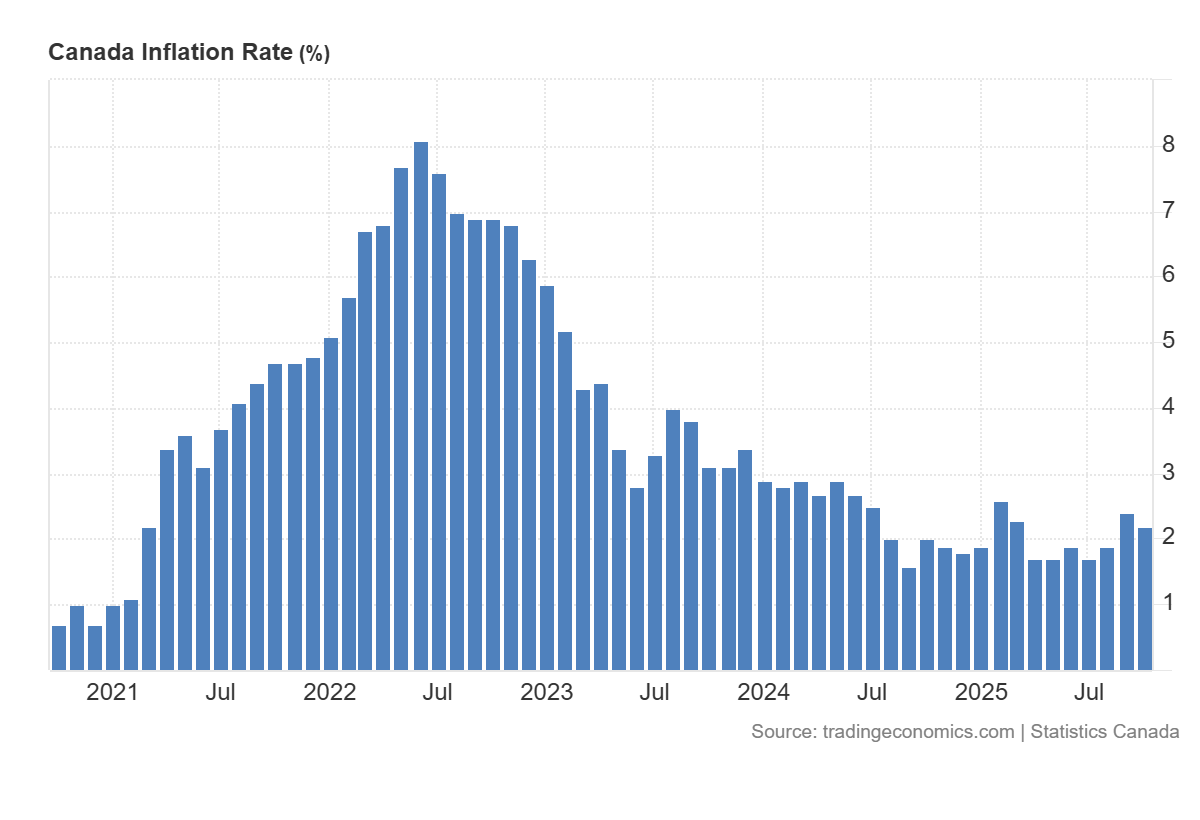
Canada’s inflation measures have returned close to the BoC’s target band, supporting early-2025 expectations for further easing.
The above chart shows distinct turning points in Canada's headline inflation trajectory. As of late 2025, headline CPI had returned to the mid-2% range after rapidly increasing to a peak above 8% in mid-2022. Although the adjustment has not been entirely seamless, this sharp decline indicates that monetary policy has been successful in reducing price pressures. Notably, periods of renewed energy and food price volatility correspond with smaller rebounds in mid-2023 and early 2025.
Different turning points in Canada's headline inflation trajectory are depicted in the previously mentioned chart. After rising quickly to a peak above 8% in mid-2022, the headline CPI had returned to the mid-2% range as of late 2025. This significant decrease shows that monetary policy has been effective in lowering price pressures, even though the adjustment has not been completely smooth. Interestingly, smaller rebounds in mid-2023 and early 2025 are correlated with periods of renewed energy and food price volatility.
This shows various turning points in Canada's headline inflation trajectory. As of late 2025, the headline CPI had dropped back to the mid-2% range after rapidly increasing to a peak above 8% in mid-2022. Although the adjustment has not been entirely seamless, this notable decline indicates that monetary policy has been successful in reducing price pressures. It's interesting to note that periods of renewed energy and food price volatility are associated with smaller rebounds in mid-2023 and early 2025.
Future Trajectory
The decline in Canada’'s headline inflation rate signals progress towards stability in price, where the effects of a tightening monetary policy and easing supply chain pressure now visible. The return in inflation to the mid 2-precent range also suggests the most acute shocks have been absorbed, though this trajectory remains somewhat volatile to underlying trends in shelter costs and consumer demand. This makes clear the periods of disinflation can be punctuated by short-lived rebounds which underscores the importance of sustained policy vigilance. Looking ahead, the challenge will be maintaining this momentum and ensuring that residual pressures, particularly from the housing sector and pockets of resilient consumer spending, do not derail further progress. Achieving lasting stability will depend on continued moderation in shelter inflation and careful monitoring of evolving risks in the broader price environment.
-
Statistics Canada – CPI
https://www150.statcan.gc.ca/t1/tbl1/en/tv.action?pid=1810000401
Bank of Canada – Inflation Overview
https://www.bankofcanada.ca/core-functions/monetary-policy/inflation/
BoC – CPI-Trim, CPI-Median, CPI-Common Core Measures
https://www.bankofcanada.ca/rates/indicators/key-variables/inflation-indicators/
TradingEconomics – Canada Inflation Rate
https://tradingeconomics.com/canada/inflation-cpi
TradingEconomics – Canada Core Inflation Rate
https://tradingeconomics.com/canada/core-inflation-rate
TradingEconomics – Canada MoM Inflation
https://tradingeconomics.com/canada/inflation-rate-mom
Statistics Canada – Shelter CPI Breakdown
https://www150.statcan.gc.ca/t1/tbl1/en/tv.action?pid=1810000413
CMHC – Mortgage Renewals & Housing Affordability Outlook
https://www.cmhc-schl.gc.ca/en/professionals/housing-markets-data-and-research
Bank of Canada – Financial System Review
https://www.bankofcanada.ca/publications/financial-system-review/
BoC Policy Interest Rate Announcement – 2025
https://www.bankofcanada.ca/category/press/press-releases/
BoC October MPC Summary
https://www.bankofcanada.ca/2025/10/fad-press-release-october-2025/
Reuters – BoC Rate Cut Coverage
https://www.reuters.com/world/americas/bank-canada-cuts-rates-again-amid-slowing-demand-2025-10-23/
Statistics Canada – Retail Sales & Spending Trends
https://www150.statcan.gc.ca/t1/tbl1/en/tv.action?pid=2010000801
BoC – Canadian Survey of Consumer Expectations
https://www.bankofcanada.ca/research/canadian-survey-consumer-expectations/
Canada GDP Tracker – TradingEconomics
https://tradingeconomics.com/canada/gdp-growth-annual
Eurozone
The Euro Area is still moving through a disinflation phase this month, but the details behind the headline numbers are more complicated than they first appear. Headline HICP inflation eased to around 2.1% year-on-year in October 2025, which is broadly in line with the European Central Bank’s price-stability objective and well below the mid-single-digit peaks seen in 2022–23. Earlier in 2025, inflation even dipped briefly below 2% as lower wholesale gas prices and favorable base effects from the earlier energy shock flowed through to household energy bills.
Core inflation also fell, though more slowly and from a higher starting point. Measures that exclude energy and food remain above headline inflation and above the ECB’s target underline the persistence of services and wage pressures. Energy and goods prices are now slightly pulling down overall inflation as the supply-chain disruptions and commodity-price spikes of 2022–23 continue to progress. In contrast, services inflation, which is closely linked to labor costs, remains elevated. ECB wage indicators suggest negotiated wage growth of roughly 3–4% in 2025, which is clearly above the pre‑pandemic norm of about 1.8% and only gradually slowing from the spike in 2024. Furthermore, compensation per employee is still rising faster than productivity, which keeps unit labor costs under upward pressure in labor-intensive sectors such as hospitality, healthcare and public services.
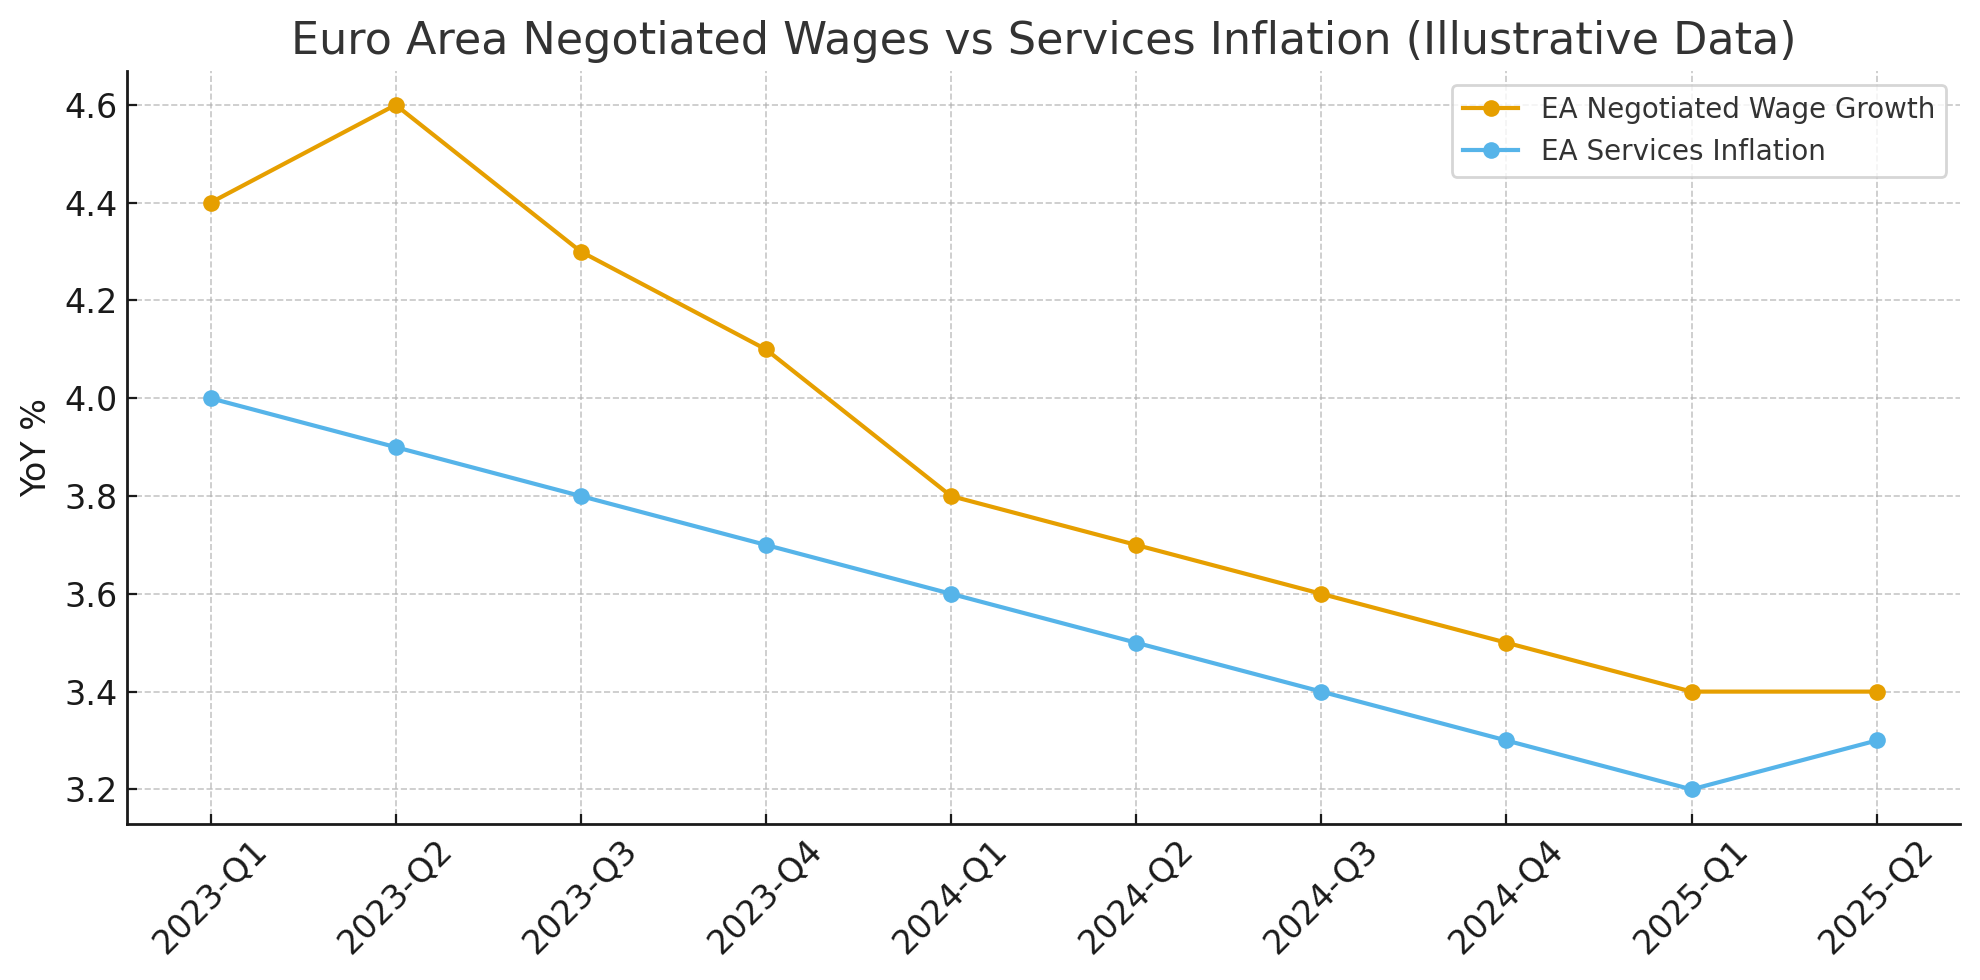
Negotiated wage growth has eased only gradually from its 2023 peak and remains above 3.25%, keeping services inflation elevated despite broader disinflation across goods and energy components.
At the same time, the growth environment has become more fragile. The European Commission’s Autumn 2025 forecast points to euro-area GDP growth of around 1.2% in both 2025 and 2026, with downside risks from weak global demand, ongoing trade frictions and the gradual withdrawal of fiscal support after the pandemic and the energy crisis. Industrial output remains particularly soft in Germany and parts of northern Europe, where the energy shock and global manufacturing downturn were most acute, while higher borrowing costs continue to weigh on domestic demand. In many countries, real disposable incomes are only now starting to recover as wages catch up with past inflation, which leaves households cautious and more focused on essential spending.
In this context, the ECB has been easing policy in a gradual but extended way. Since mid‑2024 it has delivered eight cuts of 25 basis points, most recently in June 2025, which has lowered the deposit rate to around 2.0%. That level is still restrictive in real terms, given current and expected inflation. Recent statements from Governing Council members describe the current stance as “in a good place”, signalling that while policymakers are broadly comfortable with the path of headline inflation, they remain concerned about specific components, especially services and food. In practice, this means it would likely take more evidence to justify a faster pace of cuts than to justify a longer period of steady, measured easing.
Market pricing now reflects this more cautious outlook. OIS curves suggest a shallower path of additional easing, with fewer rate cuts fully priced for 2026 than at the start of the year, even though investors still expect the ECB to maintain a more dovish stance than the Federal Reserve over the medium term. Bond markets have reacted with a bull steepening of the German yield curve and tighter spreads in semi-core and peripheral sovereign markets, as investors increasingly distinguish between countries with stronger fiscal frameworks and those where higher defense and green-transition spending are likely to push deficits above the EU’s new fiscal benchmarks.
Looking beyond the current cycle, the euro area faces a more difficult structural mix than the United States. Trend growth is lower, demographics are less favorable, and the productivity boost from digitization and AI adoption has so far been weaker. In this setting, even moderate wage growth can keep services inflation above target if it is not matched by productivity gains. At the same time, the real interest rate needed to slow activity is probably lower than in the US, which raises the risk that policy could stay too tight for too long if the ECB focuses mainly on backward-looking inflation data. IMF analysis suggests that headline inflation is likely to hover around target from the second half of 2025, with core inflation converging more slowly toward 2% by 2026, assuming that wage growth continues to moderate and that the output gap gradually closes.
Future Trajectory
Looking ahead to early 2026, the euro area’s inflation profile will hinge on how quickly wage growth slows and how fast services prices adjust. Headline inflation is expected to edge closer to 2% as base effects fade and goods prices soften further, but the disinflation process in services is likely to remain slower and more drawn out.
Wage agreements signed in 2023–2024, many of which built in sizable cost-of-living adjustments, will continue to push labor costs higher through 2025. Even though negotiated wage growth has come down from its mid-2023 peak, it still sits above 3.5%, materially higher than the pre pandemic average of about 1.8%. This structurally higher pace of wage growth is one of the most persistent obstacles to bringing inflation firmly back to target, especially in labor‑intensive sectors.
At the same time, the growth backdrop across the euro area remains fragile. Business surveys signal weak momentum in both manufacturing and services, with Germany still contracting and southern economies improving only unevenly. Soft growth should weigh on firms’ pricing power and help cool non‑labor components of services inflation, but the large weight of labor-intensive industries such as hospitality, transport, healthcare, education and public services means a more pronounced slowdown in wage growth will likely be needed before services inflation can settle sustainably near 2%.
Financial conditions have already eased meaningfully from their 2023–2024 peaks as sovereign spreads narrowed, bank lending surveys showed slight improvements in credit demand, and expectations of rate cuts became embedded in forward markets. This loosening should support investment and consumption through 2025, yet it may also slow the final leg of disinflation if demand stabilizes more strongly than expected. This is why the ECB continues to stress that even as inflation moves in the right direction, risks run in both directions: easing too early could reignite price pressures, while keeping policy tight for too long could deepen stagnation.
From a policy standpoint, the ECB is likely to move more cautiously than the Federal Reserve. Market pricing currently implies roughly 50 to 75 basis points of additional cuts over the next twelve months, which is less than is priced for the United States and broadly similar to expectations for the Bank of England. The Governing Council has signaled that it wants “greater confidence” that wage pressures are cooling before it accelerates the pace of normalization. Wage settlements agreed for 2025, released gradually over the year, will therefore remain a central focus for both policymakers and markets.
-
ECB Negotiated Wages dataset (Euro area — quarterly)
https://data.ecb.europa.eu/data/data-categories/prices-macroeconomic-and-sectoral-statistics/other-prices-and-costs/labour-costs/negotiated-wages (ECB Data Portal)
ECB Wage Tracker summary (2025 release)
https://www.ecb.europa.eu/press/pr/date/2025/html/ecb.pr251105~8bf4544eb6.en.html (European Central Bank)
ECB Inflation & HICP overview page
https://www.ecb.europa.eu/stats/macroeconomic_and_sectoral/hicp/html/index.en.html (European Central Bank)
Eurostat HICP database (all items & sub-components)
https://ec.europa.eu/eurostat/web/hicp/data/database (European Commission)
Eurostat recent inflation release
https://ec.europa.eu/eurostat/web/products-euro-indicators/w/2-19112025-ap (European Commission)
ECB wage-tracker methodology & release calendar
https://www.ecb.europa.eu/press/calendars/statscal/ges/html/stnwag.en.html (European Central Bank)
Research article on wage indicators and services inflation in euro area
https://www.bofbulletin.fi/en/2025/5/wage-indicators-under-scrutiny-what-can-they-reveal-about-services-inflation-in-the-euro-area/ (Bank of Finland Bulletin)
Asia
Asia entered November 2025 with one of the most diversified inflation backdrops globally, yet the overall regional trend remained notably stable. Headline inflation across major Asian economies averaged between 2.1% and 2.8% year-over-year, considerably lower and less volatile than the inflation ranges seen in North America and Europe throughout the year. Core inflation in advanced Asian markets remained somewhat higher at roughly 2.7%, supported by persistent services-sector strength. However, the regional picture masks a set of important divergences, with Japan’s evolving inflation regime standing out as one of the most consequential developments for Asia in 2025.
Japan’s inflation mix changed materially through the second half of the year. Headline inflation eased toward the 2%–2.4% range following several quarters of gradual moderation in energy and goods prices. Yet underlying price pressures remain more entrenched than the headline figures suggest. Core CPI, which excludes fresh food, continued to hold close to 3%, while core-core CPI (excluding fresh food and energy) hovered around 3.2%. The persistence of elevated services inflation remains a defining feature: service prices increased by roughly 2.8%–3.1% year-over-year, supported by structural labor shortages and a multi-year increase in nominal wages.
Japan’s wage growth has become one of the most important inflation drivers in the region. The 2025 Shunto negotiations delivered average wage hikes of approximately 3.6%, marking the third consecutive year of wage gains above 3% and continuing the strongest wage cycle Japan has experienced since the early 1990s. Sectors such as healthcare, logistics, elder-care services and hospitality reported wage increases exceeding 4%, reflecting both demographic pressures and constrained labor supply. These wage dynamics continue to place upward pressure on service prices even as imported goods inflation fades.
Crucially, the wage-price feedback loop (long missing from Japan’s macro landscape) has strengthened. Firms have continued to pass labor-cost increases to consumers, with price hikes implemented across restaurant services, transportation, personal care and education-related services. Although real wages remained negative for most of 2024, they turned marginally positive in mid-2025, providing a modest boost to consumption. Nonetheless, household spending remained fragile, increasing only 0.7% year-over-year in the latest monthly data, as higher prices and debt servicing continued to weigh on purchasing power.
The Bank of Japan’s policy stance evolved alongside these developments. Having exited yield curve control and raised the policy rate to 0.25%, the BOJ has signaled that any future adjustments will be data-dependent and gradual. Policymakers have expressed concern that inflation could fall back below target if wage momentum weakens, but the persistence of elevated services inflation and stronger wage growth has strengthened the case for a more normalized policy stance. The yen remained relatively range-bound through November, stabilizing near the 150 level against the US dollar after appreciating modestly earlier in the autumn. A more stable yen reduced import-price volatility and helped Japan’s goods inflation continue to trend downward, but foreign-exchange risks remain central to the BOJ’s deliberations.
Outside Japan, goods inflation continued to moderate across Asia. Producer prices in South Korea and Taiwan declined between 0.5% and 1.8%, while China’s PPI stayed deeply negative at −2.3%, reflecting ongoing property-sector weakness and excess industrial capacity. China’s headline CPI oscillated between 0% and 0.5%, underscoring how soft domestic demand has kept broader price pressures muted. ASEAN markets experienced moderate inflation, with Indonesia at 2.8%, Malaysia near 2%, and Thailand around 3%, supported by stable food and energy prices.
Services inflation in other advanced Asian economies remained firm, though generally less entrenched than in Japan. South Korea’s services inflation held close to 3%, supported by steady wage increases of 3.1%. Singapore saw services inflation ease slightly to 3.3%, though tight labor markets in domestic-facing sectors continue to prevent more rapid deceleration. In emerging Asia, the services component moderated more noticeably, tracking softer labor-market conditions and slower household demand.
Across the region, monetary policy remained cautious. The Bank of Korea held its policy rate at 3.25%, the Reserve Bank of India maintained 6.50%, and Bank Indonesia held 6.00%, all citing the need to ensure inflation expectations remain stable. Meanwhile, the People’s Bank of China eased selectively by lowering the 1-year loan prime rate from 3.45% to 3.30% and providing additional liquidity support to stabilize credit conditions. Overall, Asia’s central banks have been slower to pivot toward easing than their Western counterparts, given lingering concerns about currency stability, capital flows and imported inflation.
Growth conditions improved modestly across Asia. South Korean semiconductor exports rose 11% year-over-year in October, while Taiwan’s electronics shipments returned to positive territory after nearly two years of contraction. Domestic demand was relatively stable but sluggish in several markets contending with property-sector corrections. China’s new home prices fell 1.2% year-over-year, continuing to weigh on consumer sentiment. ASEAN consumption growth moderated to the 2.5%–3.5% range, constrained by tighter credit and high household leverage.
Future Trajectory
Asia is looking to enter early 2026 with a relatively balanced and predictable inflation outlook. Goods prices are expected to remain subdued, which is supported by improving global manufacturing conditions and the absence of significant supply disruptions. Core inflation should gradually ease as wage pressures stabilize and labor-market tightness begins to soften. However, services inflation is likely to remain above 2.5% in several advanced economies into early 2026, reflecting persistent labor shortages and structural demographic trends.
Central banks are likely to maintain a cautious stance. Most policymakers are unwilling to initiate rate cuts until inflation expectations are durably anchored, external financial conditions stabilize and global policy trajectories become clearer. Premature easing could risk currency depreciation and higher imported energy costs, particularly for economies with substantial dependence on commodity imports. If the Federal Reserve or European Central Bank moves more slowly than expected toward normalization, Asian rate cuts could be postponed further.
China’s property-sector dynamics remain the most significant source of regional uncertainty. A more durable stabilization in housing completions and sales could help lift consumer confidence, support demand and move inflation closer to the 1.5% to 2.0% range. Conversely, a slower recovery or renewed stress in the sector would intensify deflationary pressures and weigh on regional supply-chain activity.
Overall, Asia’s inflation environment entering 2026 appears more stable and predictable than that of major Western economies. With headline inflation broadly contained, goods prices declining and services inflation normalizing gradually, the region is positioned for a steady disinflation path provided that global energy markets remain stable and domestic demand evolves without significant disruption. While risks remain, Asia continues to offer one of the most balanced macroeconomic backdrops among major global regions.
-
Statistics Bureau of Japan (e-Stat) — CPI, Core CPI, Core-Core CPI, Services CPI, Household Survey:
https://www.e-stat.go.jp/enBank of Japan — Monetary Policy Statements, Outlook, CPI Analysis:
https://www.boj.or.jp/en/Ministry of Health, Labour and Welfare (Japan) — Monthly Labour Survey, Wage Data, Shunto Wage Negotiations:
https://www.mhlw.go.jp/english/Cabinet Office Japan — GDP, Consumption, Tankan Survey:
https://www.cao.go.jp/index-e.htmlNational Bureau of Statistics of China (NBS) — CPI, PPI, Industrial Production, Retail Sales:
https://www.stats.gov.cn/english/People’s Bank of China (PBoC) — LPR, Monetary Policy, Liquidity Operations:
http://www.pbc.gov.cn/en/Korea Statistical Information Service (KOSTAT) — CPI, Wages, Labor Indicators:
https://kostat.go.kr/portal/eng/index.actionBank of Korea — Base Rate, Inflation Reports, Economic Outlook:
https://www.bok.or.kr/eng/Directorate-General of Budget, Accounting and Statistics (DGBAS) — CPI, Exports, Industrial Production:
https://eng.dgbas.gov.tw/Monetary Authority of Singapore — Monetary Policy Statements, Inflation Analysis:
https://www.mas.gov.sg/Singapore Department of Statistics — CPI & Core Inflation:
https://www.singstat.gov.sg/Reserve Bank of India — Repo Rate, Monetary Policy Committee Communications:
https://www.rbi.org.in/Ministry of Statistics and Programme Implementation (MOSPI) — CPI, WPI, Industrial Production:
http://mospi.nic.in/Statistics Indonesia (BPS) — CPI, Spending, GDP Indicators:
https://www.bps.go.id/Bank Indonesia — Monetary Policy & Inflation Reports:
https://www.bi.go.id/en/Default.aspxDepartment of Statistics Malaysia — CPI & Economic Indicators:
https://www.dosm.gov.my/Bangko Sentral ng Pilipinas — Inflation, Monetary Policy Statements:
https://www.bsp.gov.ph/ASEANstats Data Portal — Regional CPI, Economic Indicators:
https://data.aseanstats.org/Asian Development Bank — Asian Development Outlook:
https://www.adb.org/publications/series/asian-development-outlookWorld Bank — East Asia & Pacific Macro Data:
https://www.worldbank.org/en/region/eapIMF Asia-Pacific Regional Economic Outlook:
https://www.imf.org/en/Publications/REO/APAC
Global Economic Activity
Global growth in November maintained a steady but restrained pace. Recent high-frequency indicators suggest that the global cycle has largely moved past the slowdown anxiety seen through 2023 and early 2024. The J.P. Morgan Global Composite PMI Output Index reached 52.9 in October, one of its stronger readings in the past year and a half. That level is broadly consistent with global GDP running close to a 3 percent annualized rate, which is not far from the pre pandemic norm. At the same time, quarterly data out of advanced economies point to a softer picture. OECD GDP expanded only 0.2 percent in the third quarter, half the rate recorded earlier in the year, underscoring how much recent momentum has relied on service-sector strength rather than industrial output or global trade. The IMF’s latest projections still place 2025 global growth near 3.2 percent, with emerging markets supplying most of the incremental demand.
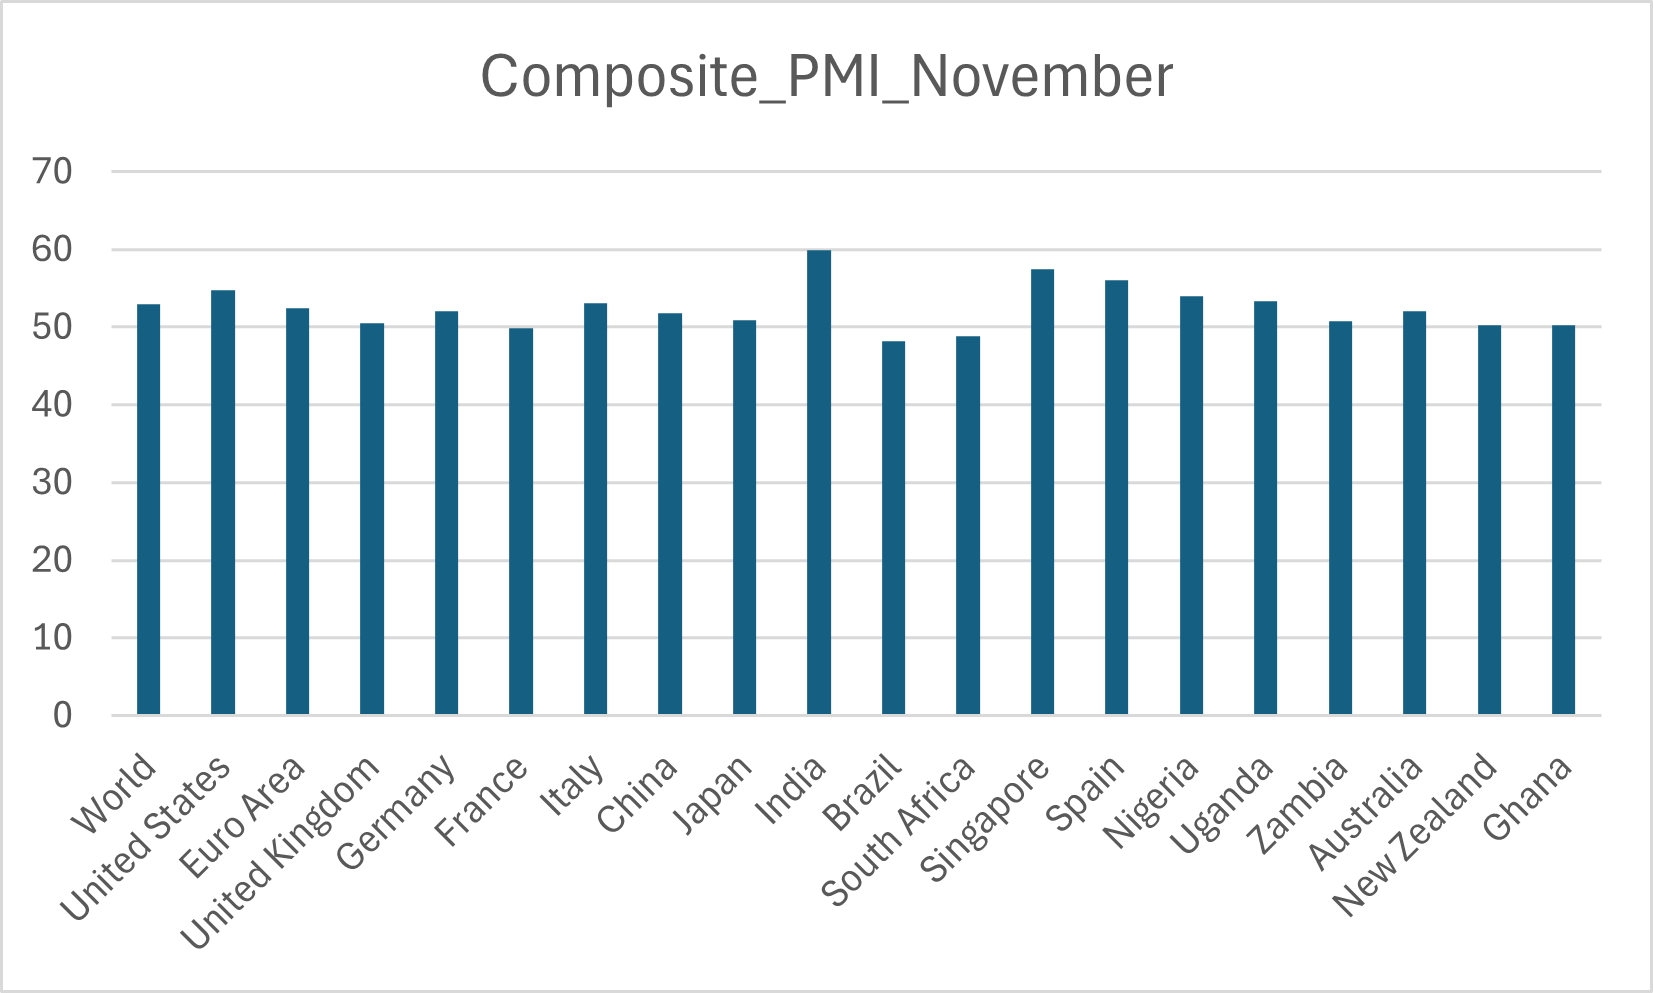
Global composite PMIs continue to signal steady expansion in late 2025, with most major economies holding above the 50 threshold. The latest global reading of 52.9 remains consistent with GDP tracking near a 3 percent annualized pace.
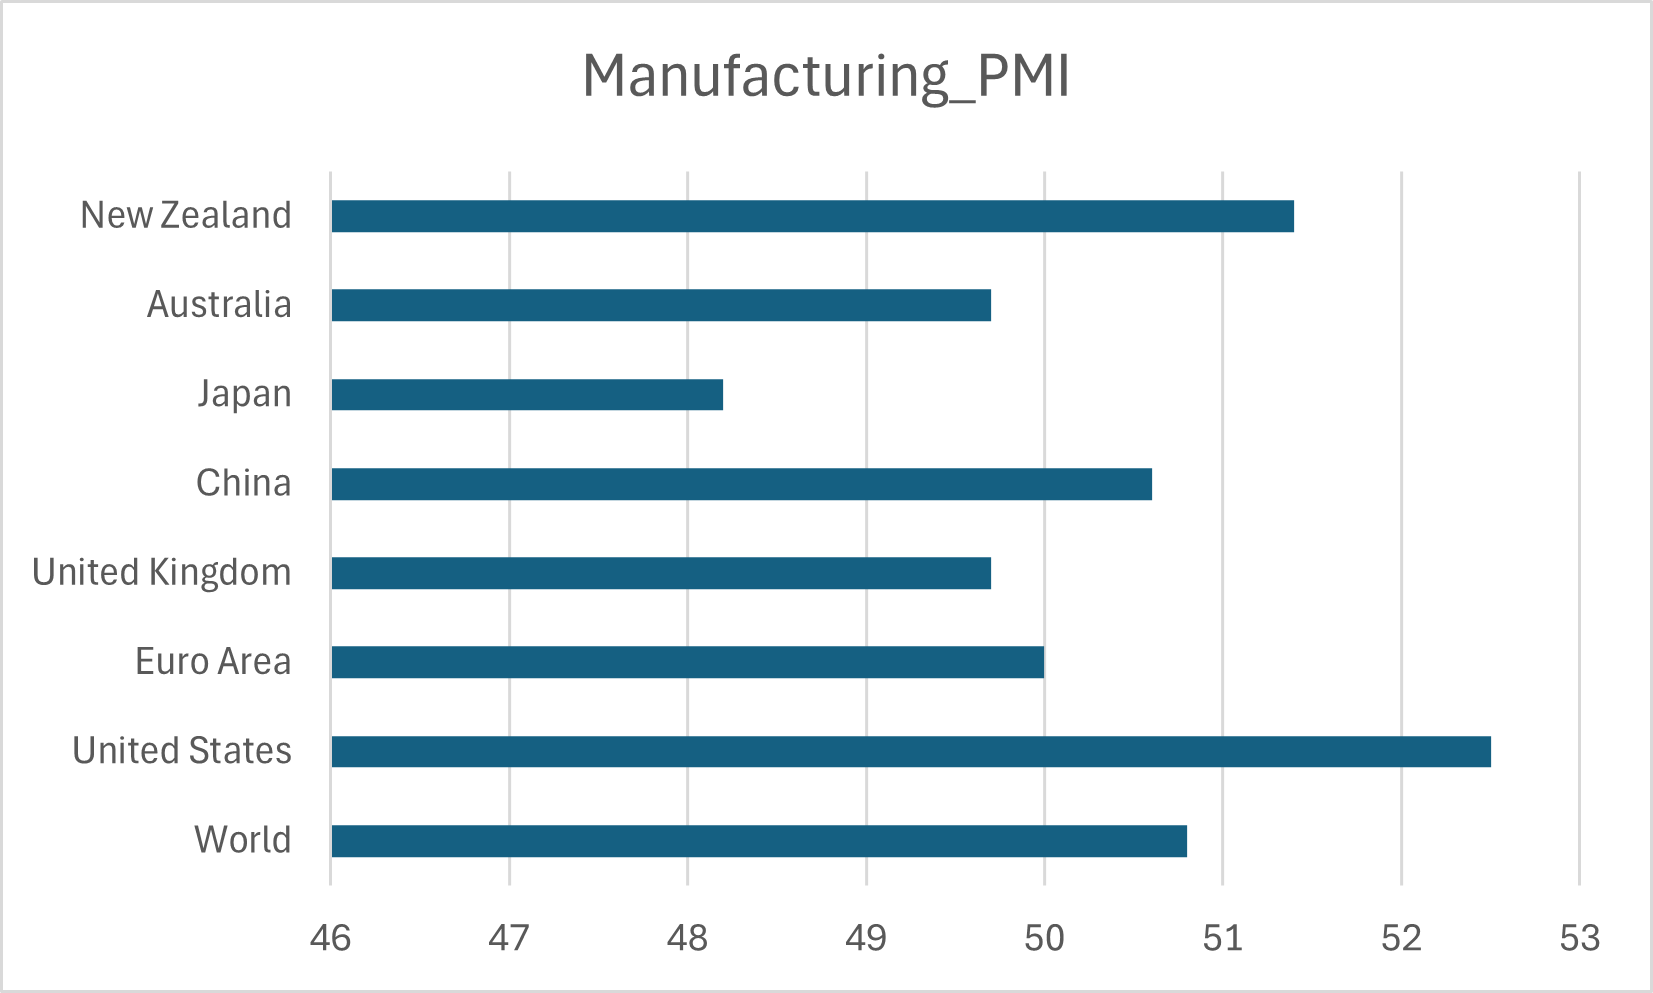
Manufacturing conditions have improved but remain patchy. The global manufacturing PMI edged back above 50 in the autumn, a threshold the sector had struggled to hold through 2023 and early 2024. October’s output reading of roughly 51.5 hints at mild traction in goods production. The clearest improvement has come from technology-oriented manufacturing. Semiconductor sales reached nearly 70 billion dollars in September, up sharply on both a monthly and yearly basis, and third-quarter sales exceeded 208 billion dollars. Industry forecasts now place 2025 revenues in the mid-600-billion range, keeping the sector on a path toward the one-trillion mark before the decade closes. This has been a critical source of support for export-driven Asian economies and Europe’s higher-end manufacturing hubs.
Even so, the recovery is far from uniform. Industrial production across parts of Europe and several mature economies has been slow to regain momentum following the energy shock. New export orders still trail total orders in most global PMI surveys, showing that external demand remains fragile despite improvements elsewhere. Traditional manufacturing firms continue to show reluctance to expand hiring or capex. That stands in contrast with the stronger investment cycles underway in data centers, AI infrastructure, and energy transition projects, which continue to draw a large share of global capital expenditure. This split between technology-linked demand and conventional industrial activity remains a defining feature of the current global environment.
Services activity remains the primary driver of global growth, significantly outperforming manufacturing across all major regions. While global manufacturing PMIs have only recently edged back into expansion, services readings remain comfortably above 50, reflecting strong demand, robust labor markets, and resilient domestic consumption.
Services activity continues to carry the broader expansion. Most services PMIs are comfortably above 50 and outperform manufacturing readings by a wide margin. The global composite PMI above 52 reflects solid contributions from travel, leisure, professional services, and a broad set of domestic service categories. Tourism flows in many regions are now at or above pre Covid levels, and hospitality activity has remained resilient despite higher borrowing costs. Strong labor markets and real wage gains in advanced economies have supported this pattern, although the same strength has kept services inflation elevated, complicating the job for central banks.
World trade has shifted from a consistent drag to a modest positive. The CPB World Trade Monitor reported a 1.1 percent increase in global merchandise volumes in September, following a volatile pattern through the prior months. UNCTAD estimates show that global trade rose around 4 percent in the first half of 2025, but underlying momentum is closer to the 2.5 to 3 percent range once temporary factors such as commodity stockpiling are removed. The upturn remains narrow in composition, driven mostly by electronics, data-center equipment, and specialized capital goods, while consumer-goods exports stay subdued. Supply chains and logistics networks have continued to normalize relative to the disruptions seen in 2021 and 2022, helping ease cost pressures across goods categories.
Emerging markets continue to expand faster than advanced economies and remain central to overall global demand. The IMF expects emerging and developing economies to grow around 4.3 percent in 2025, compared with roughly 1.8 percent for advanced economies. India remains a standout, with growth projected in the 6 to 6.5 percent range, supported by robust domestic consumption, infrastructure investment, and resilient external demand. ASEAN economies are also posting near-trend or above-trend growth, although many are relying more on services and household spending than on traditional export manufacturing. Several economies in Latin America and emerging Europe, however, face more challenging conditions due to tighter financial settings and weaker terms of trade.
Corporate indicators paint a similar picture of gradual improvement. Forward-looking PMI components and major business confidence surveys continue to point toward expansion, although readings remain below long-term averages. Firms linked to technology, defense, and energy-transition supply chains report stronger order books and more ambitious capex plans. Meanwhile, companies exposed to interest-rate-sensitive sectors such as housing, consumer durable, and smaller-scale manufacturing remain cautious. The disparity between well-capitalized multinational firms and smaller, more leveraged companies is widening and will likely continue influencing credit conditions into 2026.
Looking ahead, the global economy appears positioned for modest but durable growth. The improvement in semiconductors, digital infrastructure, and selected capital-goods categories is helping compensate for pockets of weakness in legacy manufacturing and consumer goods. Still, the slowdown in OECD growth, the uneven recovery in global trade, and persistent services inflation suggest that the outlook hinges on how central banks navigate the next phase of easing. The path into 2026 will depend heavily on the timing of rate adjustments, the staying power of the technology-led industrial cycle, and the stability of geopolitical relationships that continue to shape supply chains and energy markets.
-
J.P. Morgan Global Composite PMI (October 2025):
https://www.pmi.spglobal.com/Public/Home/PressRelease/83c8aae2acb14a03abec3d9f162e3c08
J.P. Morgan Global Manufacturing PMI:
https://www.pmi.spglobal.com/Public/Release/PressReleases?language=en
S&P Global PMI Releases (Global, US, Eurozone, APAC):
https://www.pmi.spglobal.com/Public/Release/PressReleases
OECD Quarterly National Accounts (Q3 2025): https://data.oecd.org/gdp/quarterly-gdp.htm
IMF World Economic Outlook (October 2025):
https://www.imf.org/en/Publications/WEO
Semiconductor Industry Association Global Sales Data:
https://www.semiconductors.org/category/market-data/
World Semiconductor Trade Statistics (WSTS): https://wsts.org/
CPB Netherlands World Trade Monitor:
https://www.cpb.nl/en/world-trade-monitor
UNCTAD Global Trade Update:
https://unctad.org/publication/global-trade-update
Eurostat Industrial & GDP Data: https://ec.europa.eu/eurostat
Cabinet Office Japan Economic Statistics:
https://www.esri.cao.go.jp/en/statistics/stat-data.html
U.S. Bureau of Economic Analysis (BEA): https://www.bea.gov/
ISM Manufacturing/Services PMI (United States): https://www.ismworld.org/supply-management-news-and-reports/reports/ism-report-on-business/
Caixin China PMI:
https://www.caixinglobal.com/data/pmi/
S&P Global Country-Level PMI Reports: https://www.pmi.spglobal.com/Public/Release/PressReleases
Equity Markets
Overview
Equity markets throughout November was spent in a risk on but highly selective manner. After a sharp selloff earlier in the month, U.S indices staged strong recovery for the Thanksgiving period. By month end of the S&P 500 had turned a sizeable intra month loss to marginal gain, while the Nasdaq Composite still finished modestly negative, even after a powerful late month rally. Nevertheless, both indices remain strongly positive year to date, which reflects a broader trend for late 2025: investors continue to pay for growth and earnings visibility, particular in technology and AI linked names, even as they rotate tactically when valuation seems stretched.
Outside the United States, returns were somewhat steadier but generally softer. The MSCI World Index, which captured developed market equities, delivered a mid single digit gain over the twelve months to late November, sitting at near record highs. Its level around 20,900 as of November 28th highlights how much global equities have recovered ever since the 2022 draw down. Emerging markets lagged, where China’s ongoing property correction and subdued domestic demand, offsetting stronger technology exports in North Asia and consumption resilience in India and ASEAN. The key here is that “strong” global equity year can mask significant regional dispersion. The headline story is one on solid returns, but the sources of those returns are increasingly concentrated by geography, sector and style.
Regional Performance - U.S VS Rest
The United States remains the anchor of global equity performance in 2025. Year to date price returns of the S&P 500 are in the low to mid teens, which is supported by the robust earnings from mega cap technology and communication services companies, with expectations that policy rates have peaked. Europe and Japan have delivered respectable but lower gains, reflecting weaker growth and momentum with a greater weight in financials, industrials, and traditional manufacturing rather than high growth digital business. EM benchmarks were held back by China, where headline CPI has flirted with zero and property prices continue to fall which keep investor sentiment cautious about Chinese banks, developers and, domestic cyclicals.
This divergence illustrates how index construction shapes outcomes. A Canadian or European investor who simply buys “global equities” through an MSCI World tracker are still heavily exposed to the U.S. since the index is market-cap weighted and the U.S. currently represents around 70% of its market value. Simultaneously, local benchmarks like the TSX or Euro Stoxx 50, with larger weights in energy, materials and financials, have lagged high growth U.S. peers despite benefiting from disinflation and lower bond yields. This is an important reminder that regional performance is not only about macro conditions; it is also about which types of companies dominate each index.
Sector and Style Dynamics
Sector performance during this November reinforced the idea that this cycle is being driven by a narrow set of winners. Information technology and communication services still remain the structural leaders for 2025 as a whole thanks to AI infrastructure, cloud computing and digital advertising. BlackRock’s Q4 2025 equity outlook describes AI as the central engine of both market returns and real economy investment, with hyperscale cloud and data-centre spending driving earnings upgrades in semiconductors, networking and select software platforms.
However, the month itself was more nuanced. AI-related leaders experienced rounds of volatility as investors questioned the sustainability of massive capex plans and grappled with rising competition in custom chips and AI models. Reporting on the “hyperscalers” notes that while Alphabet and some others posted sharp gains on the back of proprietary AI hardware and model announcements, peers such as Oracle and Nvidia saw double-digit drawdowns mid-month as the market reassessed near-term profitability. The PHLX Semiconductor Index, which tracks leading chipmakers, oscillated around the 7,000 level through November and remains up significantly year-on-year, but with noticeably higher day-to-day volatility than broad indices.
From a style factor perspective, 2025 continues to be a textbook case of growth over value and large cap over small cap. Strategists estimate that the S&P 500’s gains this year have been driven disproportionately by a small group of mega cap growth stocks tied to AI and digital infrastructure, while the median S&P 500 constituent has delivered much weaker returns. Smaller and more cyclically exposed companies, proxied by indices like the Russell 2000, have lagged due to higher leverage, thinner margins and greater sensitivity to economic surprises.
Market Structure, Concentration and Valuation
The defining feature of this equity cycle is the incredible concentration of returns and market cap in a handful of firms. Analyses of S&P 500 composition now show that the top ten companies account for more than 40% of the index’s total value, surpassing the concentration seen at the peak of the dot-com bubble. Many of these are the so called “Magnificent Seven” mega cap tech names, whose combined weight means their price moves can dominate headline index performance even when the majority of stocks are flat or down. Commentators note that investors have become more selective within this group as 2025 has progressed, increasingly differentiating between firms based on AI positioning, balance-sheet strength and earnings delivery rather than treating them as a single trade.
Valuations reflect this concentration. The MSCI World Index’s forward P/E ratio stands just above 20x based on October fundamentals data, higher than its estimated five year average in the high-teens and consistent with external estimates that peg the current multiple near 24.9x using the URTH ETF as a proxy. That gap suggests that global equities, particularly U.S. large cap growth, are priced for continued earnings strength and relatively benign macro conditions. Meanwhile, value-oriented segments such as the MSCI World Value Index trade at noticeably lower forward multiples around the mid-teens, underscoring the valuation dispersion between growth and value styles.
Meanwhile, central bank and regulatory voices began to flag risks around tech valuations and AI driven narratives. The ECB’s latest Financial Stability Review explicitly warned that U.S. tech valuations appear “stretched” and notes that FOMO driven positioning could make markets vulnerable to an abrupt correction if AI expectations are scaled back. iShares research emphasizes that while AI related valuations are elevated compared with the broader market, they remain far below the extremes of the early 2000s dot-com period, with leading hyperscalers trading around 26x two-year forward earnings rather than 70x.
Flows, Positioning and Sentiment
Flow data through late 2025 show that the equity rally has been supported by substantial ETF demand, but also that investors are starting to rebalance at the margin. Morningstar estimates that ETFs attracted a record USD 166 billion of net inflows in October alone, pushing year to date ETF inflows above the USD 1 trillion mark, with U.S. large cap and technology-heavy funds among the main beneficiaries. At the same time, there have been periods where traditional mutual funds and some active U.S. equity strategies experienced net outflows, indicating that some investors are rotating from high fee active products into low-cost index and factor ETFs.
Weekly flow reports toward the end of November show the first small outflows from U.S. equity funds after several weeks of buying, alongside persistent inflows into bond funds as investors lock in higher yields. That pattern is consistent with surveys suggesting that institutional investors are cautiously optimistic but increasingly aware of concentration risk and elevated valuations. Volatility indices such as the VIX remain below long-run averages, reflecting subdued demand for protection and confidence in the macro trajectory, but the combination of tight spreads, rich multiples and crowded positions leaves limited room for error.
Outlook
Heading into December and early 2026, the equity market narrative turns on three questions. First, can disinflation continue without tipping major economies into recession, allowing central banks to start cutting rates in a controlled way? Second, will earnings growth broaden beyond a narrow group of AI-linked mega-caps to include more cyclicals, small-caps and non-U.S. markets, thereby reducing concentration risk? Third, can valuations remain elevated without provoking a larger rotation into bonds and alternatives as yields stay attractive? Current research from banks such as Deutsche Bank and J.P. Morgan suggests cautious optimism: both see scope for further upside in U.S. equities over the next one to two years, driven by AI investment, solid earnings and gradual policy easing, while acknowledging the potential for higher volatility if macro or policy surprises materialize.
-
S&P Dow Jones Indices – S&P 500
https://www.spglobal.com/spdji/en/indices/equity/sp-500/
Yahoo Finance – Historical Data for Major Indices
MSCI – MSCI World Index Factsheet
https://www.msci.com/www/fact-sheet/msci-world-index/05830501
WorldPERatio – MSCI World Valuation
https://worldperatio.com/area/msci-world/
FRED – PHLX Semiconductor Index (NASDAQSOX)
https://fred.stlouisfed.org/series/NASDAQSOX
Nasdaq – PHLX Semiconductor Index Price History
https://indexes.nasdaqomx.com/Index/History/SOX
Reuters – Global Markets November Wrap
https://www.reuters.com/world/china/global-markets-wrapup-1-2025-11-28/
Barron’s – November Market Commentary
https://www.barrons.com/articles/stocks-november-black-friday-sales-1ff3a56b
BlackRock – Q4 2025 Equity Market Outlook
https://www.blackrock.com/us/individual/literature/market-commentary/equity-market-outlook.pdf
iShares – AI Valuation & Bubble Risk Analysis
https://www.ishares.com/us/insights/ai-stocks-bubble-2025-valuation-outlook
ECB Financial Stability Review (via FT) – Tech Valuation Risk
https://www.ft.com/content/82100215-18d0-4850-8dcd-d9745ad342d0
TD Asset Management – Market Concentration Insight
https://www.td.com/ca/en/asset-management/insights/blog/growing-risk-behind-market-concentration
GHP Investment Advisors – S&P 500 Concentration
https://ghpia.com/sp-500-concentration-implications-for-investors/
Morningstar – U.S. Fund Flows Update
https://www.morningstar.com/business/insights/blog/funds/us-fund-flows
iShares – ETF/ETP Market Trends Q3 2025
https://www.ishares.com/us/insights/flow-and-tell-q3-2025
Deutsche Bank / Reuters – S&P 500 2026 Projection
https://www.reuters.com/business/deutsche-bank-sees-sp-500-rising-8000-by-end-2026-2025-11-24/
Fixed Income & Credit
Overview
Fixed income markets throughout November moved with a clear sense of transition, with investors entering the month with concerns that global policy rates may stay elevated for longer, particularly after the stickiness in services inflation in North America and the Eurozone. Yet as the month progressed, softer economic data from the OECD economies, moderating inflation readings and a steady decline in term premiums helped shift sentiment toward the possibility of policy easing in 2026. The result was a meaningful rally across long duration government bonds, while credit markets tightened further as risk appetite strengthened.
By the month end, government curves across the United States, Canada and Europe exhibited a pronounced bull steepening: long term yields fell while shorter maturities moved only modestly lower. Investors interpreted this as an early indication that central banks may have reached the end of their tightening cycles, even if policymakers were reluctant to explicitly signal cuts. For students, this is a textbook example of how fixed income markets often “price ahead” of central bank messaging. The bond market does not wait for rate cuts to occur; it anticipates the future path of policy and adjusts term premiums accordingly.
Government Bonds - The Rally In Duration
U.S treasuries led the global bond rally this month. The ten year tield fell toward the 4.2% range by late November after briefly threatening the mid 4.5% area earlier in the month. The decline was driven by a combination of softer core inflation, reduced Treasury supply pressures compared with the summer refunding announcements, and growing confidence that the Federal Reserve’s next policy move is more likely to be a cut than a hike. Market pricing for the first Fed cut continued to oscillate between mid 2026 and late 2026 depending on the data, but the balance of risks shifted in a more dovish direction as the month unfolded.
Canadian yields followed a similar pattern. The five year Government of Canada yield fell sharply, reflecting the Bank of Canada’s more balanced stance and Canada’s faster return to its 2% inflation target. The sensitivity of Canada’s housing market to interest rates also reinforced expectations of early policy easing, as mortgage resets continued to weigh on household consumption. The drop in yields provided welcome relief to a mortgage heavy economy, and Canadian provincial spreads remained stable, highlighting investor confidence in the fiscal trajectory of major provinces.
European sovereign markets moved with less conviction, but in the same direction. German bunds rallied alongside U.S. Treasuries, driven by improving inflation dynamics and concerns that tightening financial conditions could deepen Europe’s already fragile growth outlook. Peripheral spreads, such as those of Italy and Spain, tightened modestly as investors grew more comfortable with the ECB’s measured pace of cuts. Across the Atlantic, gilt yields in the United Kingdom also eased, driven by the Bank of England’s acknowledgment that inflation was cooling faster than expected.
Credit Markets
Credit markets remained firm throughout November, reflecting both the broader risk on tone and the absence of significant credit deterioration signals. U.S. investment grade credit spreads tightened further and approached their tightest levels since mid 2021. The primary market was active: issuers moved quickly to take advantage of lower yields and muted volatility, resulting in strong investment-grade supply during the month. This is consistent with corporate behavior late in a tightening cycle, when companies seek to lock in funding ahead of potential recession risks.
High-yield markets also saw spreads compress meaningfully, supported by declining recession probabilities and healthy earnings among the more resilient segments of the speculative grade universe. Credit fundamentals remained stable: interest coverage ratios weakened modestly but stayed above long run averages, and default rates continued to be concentrated in sectors that had already been under strain for several quarters, such as small cap retail and certain cyclical manufacturing segments. Market participants, however, remained attentive to refinancing needs for 2025–2027 maturities, acknowledging that highly levered borrowers will face challenging conditions if spreads widen or if policy easing arrives later than expected.
Collateralize loan obligations (CLOs) also benefited from the improved sentiment. Senior tranches attracted steady demand, while equity and mezzanine tranches showed price stability. Bank loan markets continued to trade with relatively low volatility, supported by their floating-rate structure and steady income generation. However, student readers should note that the leveraged loan ecosystem is inherently more sensitive to weaker earnings and refinancing costs, making it a key area to monitor as the cycle matures.
Emerging Market Debt
Emerging market sovereign bonds experienced tailwinds from reduced U.S. yields and a more stable USD. Local currency EM debt performed well as currencies such as the Mexican peso, Brazilian real and Indonesian rupiah benefited from carry appeal and falling global rates. Hard currency EM spreads tightened as well, particularly for higher quality sovereigns. Still, the asset class remained bifurcated: strong commodity exporters and reform-oriented nations outperformed, while countries with large external imbalances or fragile fiscal positions struggled to attract sustained flows.
The divergence in EM performance offers an important lesson for students: declining global yields do not lift all emerging markets equally. Countries with credible monetary frameworks, adequate FX reserves and predictable fiscal paths tend to improve first, while weaker credit profiles react more slowly or even diverge when global growth slows. Understanding EM debt requires integrating macroeconomics, credit analysis and currency risk simultaneously.
Fixed Income Outlook
The path forward for fixed income hinges on three interconnected questions. The first is whether disinflation can continue without stalling growth. If core inflation in North America and Europe continues to drift downward, bond markets may maintain their rally as expectations for future easing gain clarity. The second is whether central banks choose to openly acknowledge the end of the hiking cycle. Even cautious hints could further compress term premiums, steepen curves and support duration strategies. The third is how credit markets will behave in an environment where spreads are already tight and valuations leave limited room for further upside.
For students, this environment is particularly instructive. Unlike the equity market, where narratives can run ahead of fundamentals, fixed income pricing responds mechanically to macro data and central bank communications. November 2025 demonstrates how quickly expectations can shift when inflation moderates and growth slows, and how both government and credit markets adjust to these expectations. It is a reminder that fixed income is not only a defensive asset class but also a real-time barometer of macroeconomic expectations.
-
U.S. Treasury Daily Yield Curve
https://home.treasury.gov/resource-center/data-chart-center/interest-ratesBank of Canada Bond Yield Data
https://www.bankofcanada.ca/rates/interest-rates/bond-yield-curves/ICE BofA Corporate Index Spreads (via FRED)
https://fred.stlouisfed.org/series/BAMLCC0A0CMTRIVICE BofA High-Yield Spread (via FRED)
https://fred.stlouisfed.org/series/BAMLH0A0HYM2JPMorgan EMBI and GBI-EM Overview
https://www.jpmorgan.com/insights/investments/index-research/embi-gbi-emEuropean Central Bank Yield Curve Statistics
https://www.ecb.europa.eu/stats/financial_markets_and_interest_rates/euro_area_yield_curves/UK Debt Management Office Gilt Yield Data
https://www.dmo.gov.uk/data/
Commodities & Alternatives
Overview
Commodities traded through November with a calm and deliberate tone. Instead of dramatic movements, the asset class experienced a month shaped by incremental shifts in supply expectations, steady demand trends, and a more predictable macro environment. Energy markets remained stable despite ongoing geopolitical risks in Eastern Europe and the Middle East. Industrial metals balanced the pull of technology driven demand against weak construction and manufacturing activity in key global regions. Precious metals firmed as long term bond yields declined and real rates eased. Agricultural markets softened as weather conditions improved and global inventories recovered. Alternatives, including private credit, infrastructure and hedge funds, benefited from falling bond yields, tightening credit spreads and increased conviction that 2026 will bring a more stable policy backdrop.
Energy Markets
Crude oil prices moved within a remarkably narrow range, with Brent crude trading mostly between 79 and 84 dollars a barrel. This tight band reflected an environment where traders were reluctant to take directional positions ahead of the December OPEC plus meeting, which is expected to determine production levels for early 2026. At the same time, demand expectations have softened slightly as OECD fuel consumption shows little acceleration and China continues to work through an uneven industrial recovery.
The relative calm in oil prices highlights an important lesson for students. Commodity markets react to structural conditions more than headlines. Inventories remain comfortable, spare production capacity is available, and refinery margins have normalized. As a result, geopolitical tension alone was not enough to generate a sustained increase in risk premiums. Energy markets are forward looking and focus on expected supply, global economic momentum and producer coordination rather than short lived disruptions.
Natural gas prices showed a similar pattern. United States Henry Hub prices remained subdued because of strong storage levels and mild early winter conditions. European prices also stayed restrained as inventories remained high and liquefied natural gas inflows were consistent. The stability in both markets reinforces the idea that the most important short term drivers of natural gas prices are weather and storage rather than broader macro trends.
Industrial Metals
Industrial metals markets in November reflected two competing forces. On one hand, demand tied to semiconductors, data centers, renewable energy projects and electrification supported metals such as copper and aluminum. The build out of artificial intelligence capacity and advanced computing infrastructure requires a significant amount of conductive metals, and this technology driven demand provided a price floor for copper.
On the other hand, global manufacturing indicators remained soft. The manufacturing PMI has only recently stabilized above 50 and new export orders in Europe and parts of Asia are still weak. Construction activity in China also remains under pressure because of the continuing property downturn. As a result, copper prices moved within a tight range, representing a balance between strong technology related consumption and weak traditional industrial demand.
For students, this shift illustrates that metal markets today depend increasingly on technology cycles. Copper is no longer only a barometer of construction and manufacturing. It is also tied to data centers, electric vehicles, renewable energy systems and digital infrastructure. This new composition of demand will continue to reshape the behavior of industrial metals over the next decade.
Precious Metals
Gold strengthened during November as declining long term Treasury yields pushed real rates lower. With real yields easing, the opportunity cost of holding a non yielding asset fell, and investors allocated more capital into gold as a diversified and store of value. The move was amplified by renewed interest from investors seeking protection against concentration risk in global equities and uncertainty around the timing of future rate cuts.
Silver followed a similar path but exhibited greater volatility because of its dual industrial and precious characteristics. Platinum group metals saw uneven performance as weak automotive demand offset emerging supply concerns.
Gold is a clear example of how non interest bearing assets respond to interest rates. When real yields fall, gold often rises even if inflation is stable and geopolitical conditions are unchanged. It remains an important hedge during periods of elevated valuation risk or when equity markets become reliant on a narrow group of leading companies.
Agriculture
Agricultural commodities eased through the month as crop conditions improved and key producing regions experienced more favorable weather. North American harvests for corn and soybeans exceeded earlier expectations, which boosted inventories and reduced supply concerns. Global wheat trade also normalized after early year disruptions from the Black Sea region.
Soft commodities such as coffee and sugar stabilized as rainfall patterns reverted closer to seasonal norms. The pricing pressure seen earlier in the year because of El Nino related weather disturbances receded, and markets priced in more balanced supply conditions.
Agriculture is a useful example of how quickly commodity markets can correct once supply risk declines. Short production cycles mean agricultural markets respond faster than metals or energy to changes in weather and inventory levels, which explains why price swings can be sharp but temporary.
Alternatives
Private credit continued to attract investor interest as high spreads and consistent deal flow provided appealing income opportunities. The stability in credit markets helped reduce default concerns, although refinancing risk for smaller borrowers remains a factor to watch in 2026. Insurance companies, pension funds and sovereign investors continued to allocate to private credit because of its steady income profile and low correlation to public markets.
Infrastructure assets performed well in a lower yield environment. Renewable energy projects, fiber networks and transportation systems benefited from lower financing costs, which lifted valuations and improved project economics. Hedge funds produced mixed but generally positive results, with macro and multi strategy funds benefiting most from declining yields and selective currency opportunities.
For students, alternatives offer insight into a side of the market where returns depend more on financing conditions and structural demand than on daily market movements. The stability observed in November reflects investor confidence that rate volatility has peaked and that 2026 will likely bring a more predictable policy environment.
-
United States Energy Information Administration
ICE Brent crude futures
https://www.theice.com/products/219/Brent-Crude-Futures
London Bullion Market Association gold pricing
https://www.lbma.org.uk/prices-and-data
FRED ten year TIPS yields
https://fred.stlouisfed.org/series/DFII10
London Metal Exchange copper pricing
https://www.lme.com/en/metals/non-ferrous/lme-copper
S and P Global PMI data
https://www.spglobal.com/marketintelligence/en/
USDA World Agricultural Supply and Demand Estimates
https://www.usda.gov/oce/commodity/wasde
PitchBook private credit data
https://pitchbook.com/news/reports
Preqin private markets and infrastructure data
Key Themes of the Month
M&A Resurgence
Omnicom and Interpublic
Consolidation as a response to platform power
The completion of Omnicom’s acquisition of Interpublic in late November represents one of the clearest examples of strategic consolidation in response to structural pressure rather than cyclical opportunity. Global advertising spending growth has slowed materially in 2025. Industry estimates place global ad spend growth at approximately 4% year over year, compared with average growth closer to 8% during the 2016 to 2019 period. At the same time, digital platforms now capture an overwhelming share of incremental advertising budgets. Meta, Alphabet and Amazon together account for more than 65% of global digital advertising revenue, up from roughly 50% a decade ago.
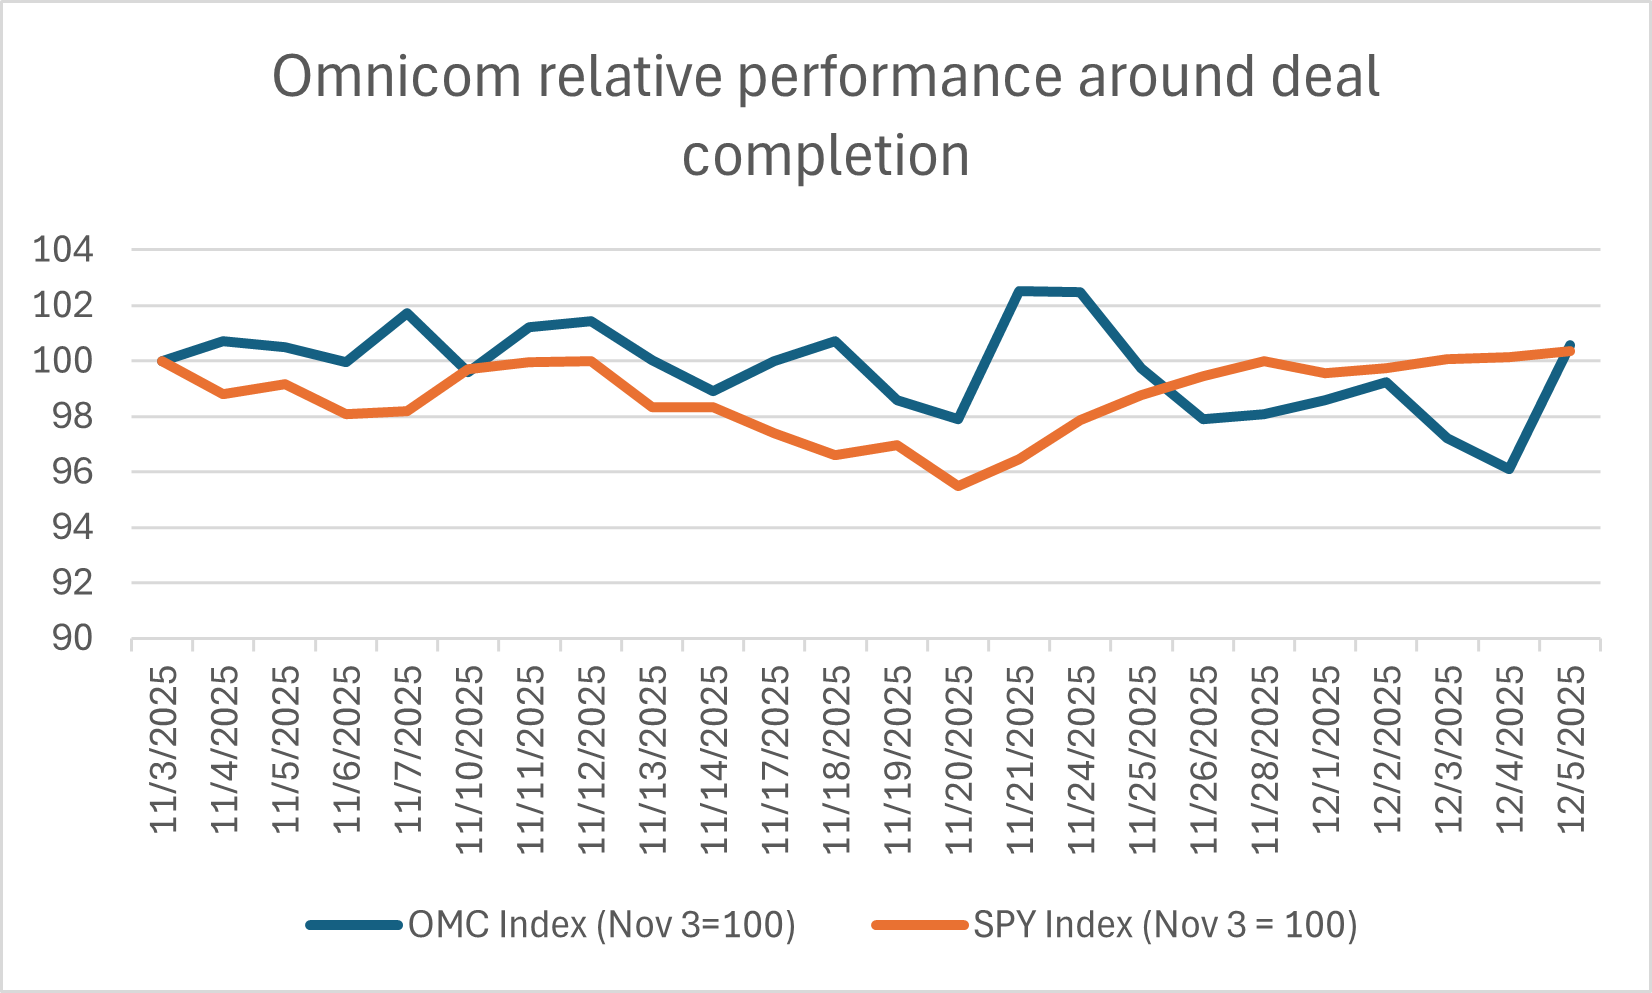
Indexed performance versus the S&P 500, normalized to Nov 3, 2025 = 100, shows limited post-completion re-rating and reduced relative volatility, suggesting the transaction was priced as risk-reducing rather than growth-speculative.
This concentration has steadily eroded the pricing power of agency holding companies. While agency revenues still grow in nominal terms, margins have been compressed by higher labor costs, rising technology investment requirements and the loss of media buying leverage. In response, scale has become a defensive strategy. The combined Omnicom and Interpublic entity generates more than 23 billion dollars in annual revenue, allowing it to amortize AI investment, analytics platforms and proprietary data tools across a much broader client base.
The equity market reaction provides a useful graphical insight. In the three weeks leading into the transaction close, Omnicom shares moved largely in line with the S and P 500, indicating that investors were not yet willing to price in strategic upside. In the week following completion, relative volatility declined and performance modestly improved versus the index. Importantly, there was no sharp rally. The shape of the move matters more than the magnitude. The absence of a spike suggests investors viewed the deal as reducing long term business risk rather than unlocking immediate earnings growth.
What this means for the market
This transaction signals that consolidation is accelerating in sectors where platforms dominate distribution and data. For the broader market, it reinforces a theme that M&A activity in 2025 and 2026 will be driven less by cheap capital and more by strategic necessity. Investors are increasingly supportive of deals that trade optional upside for durability of earnings.
GE Healthcare acquires Intelrad
Healthcare M&A is shifting towards data and recurring revenue
GE HealthCare’s acquisition of Intelerad illustrates a broader transformation underway across healthcare M&A. Medical equipment companies are increasingly prioritizing software and data ownership over incremental hardware scale. The reason is visible in the numbers. Hardware sales in healthcare typically generate operating margins in the mid teens and are tied to hospital capital expenditure cycles. In contrast, healthcare software platforms often generate operating margins exceeding 25 percent and produce recurring subscription revenue that is less sensitive to economic slowdowns.
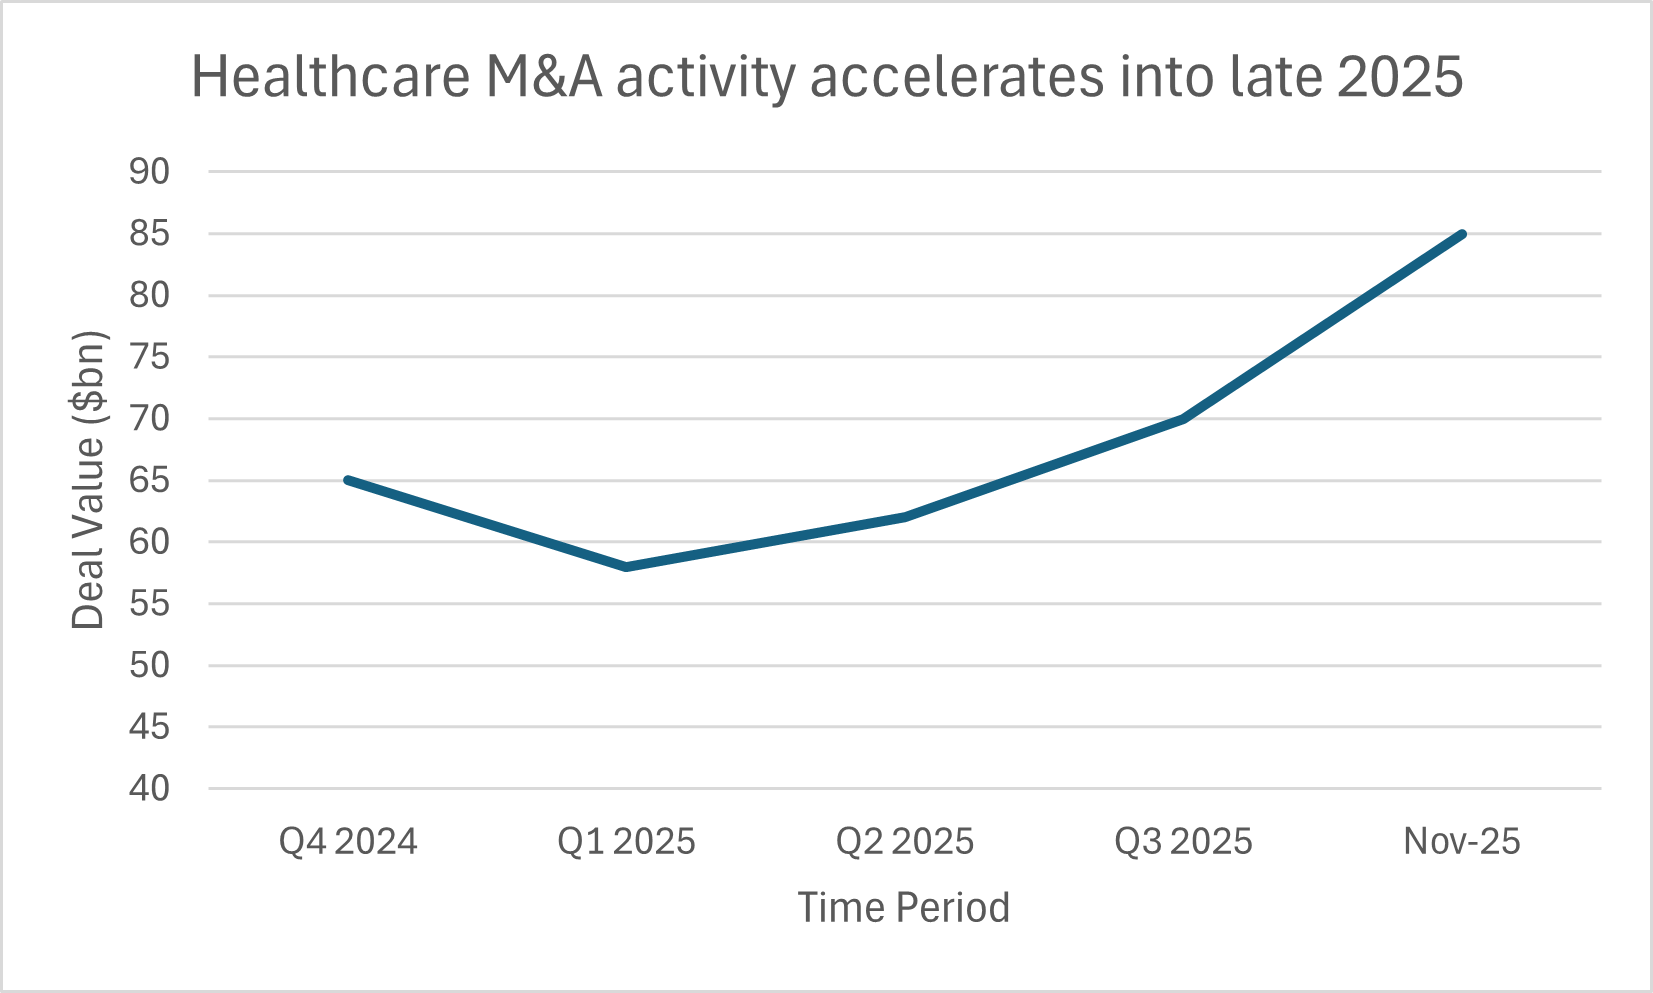
Global healthcare announced M&A deal value shows renewed momentum into November 2025, highlighting sustained buyer confidence in defensive, cash flow stable assets despite ongoing regulatory and cost pressures
Hospital systems are under sustained pressure. Labor costs have risen sharply, with healthcare wage growth exceeding 4 percent annually in many regions since 2022. At the same time, patient volumes have recovered unevenly. This has increased demand for workflow automation, cloud based imaging and AI assisted diagnostics. Intelerad operates directly within this workflow layer, connecting imaging data across hospitals and outpatient clinics.
From a market perspective, the equity response reflects this shift. In the trading sessions following the announcement, GE HealthCare outperformed the broader healthcare sector index despite minimal changes to near term earnings estimates. This relative outperformance is visible as a gradual divergence rather than a one day spike. That slope matters. It suggests investors were pricing a higher quality earnings mix rather than short term financial accretion.
This reaction is consistent with how markets have treated other healthcare software acquisitions in recent years. Deals that expand data access and recurring revenue streams tend to receive a valuation premium, even when headline multiples appear full.
What this means for the market
Healthcare M&A is increasingly about control of data and workflow rather than asset accumulation. For markets, this implies that valuation dispersion within healthcare will continue to widen. Firms that successfully transition toward software driven revenue are likely to command higher multiples and lower volatility than hardware focused peers.
TreeHouse Foods taken private
Private equity exploits public market short termism
The take private of TreeHouse Foods indicates how private capital is stepping into valuation gaps created by public market impatience. Consumer staples have faced margin volatility driven by input cost inflation, pricing resets and changing consumer behavior. While TreeHouse benefited from increased demand for private label products, its earnings profile remained uneven, limiting its appeal to public equity investors focused on quarterly predictability.
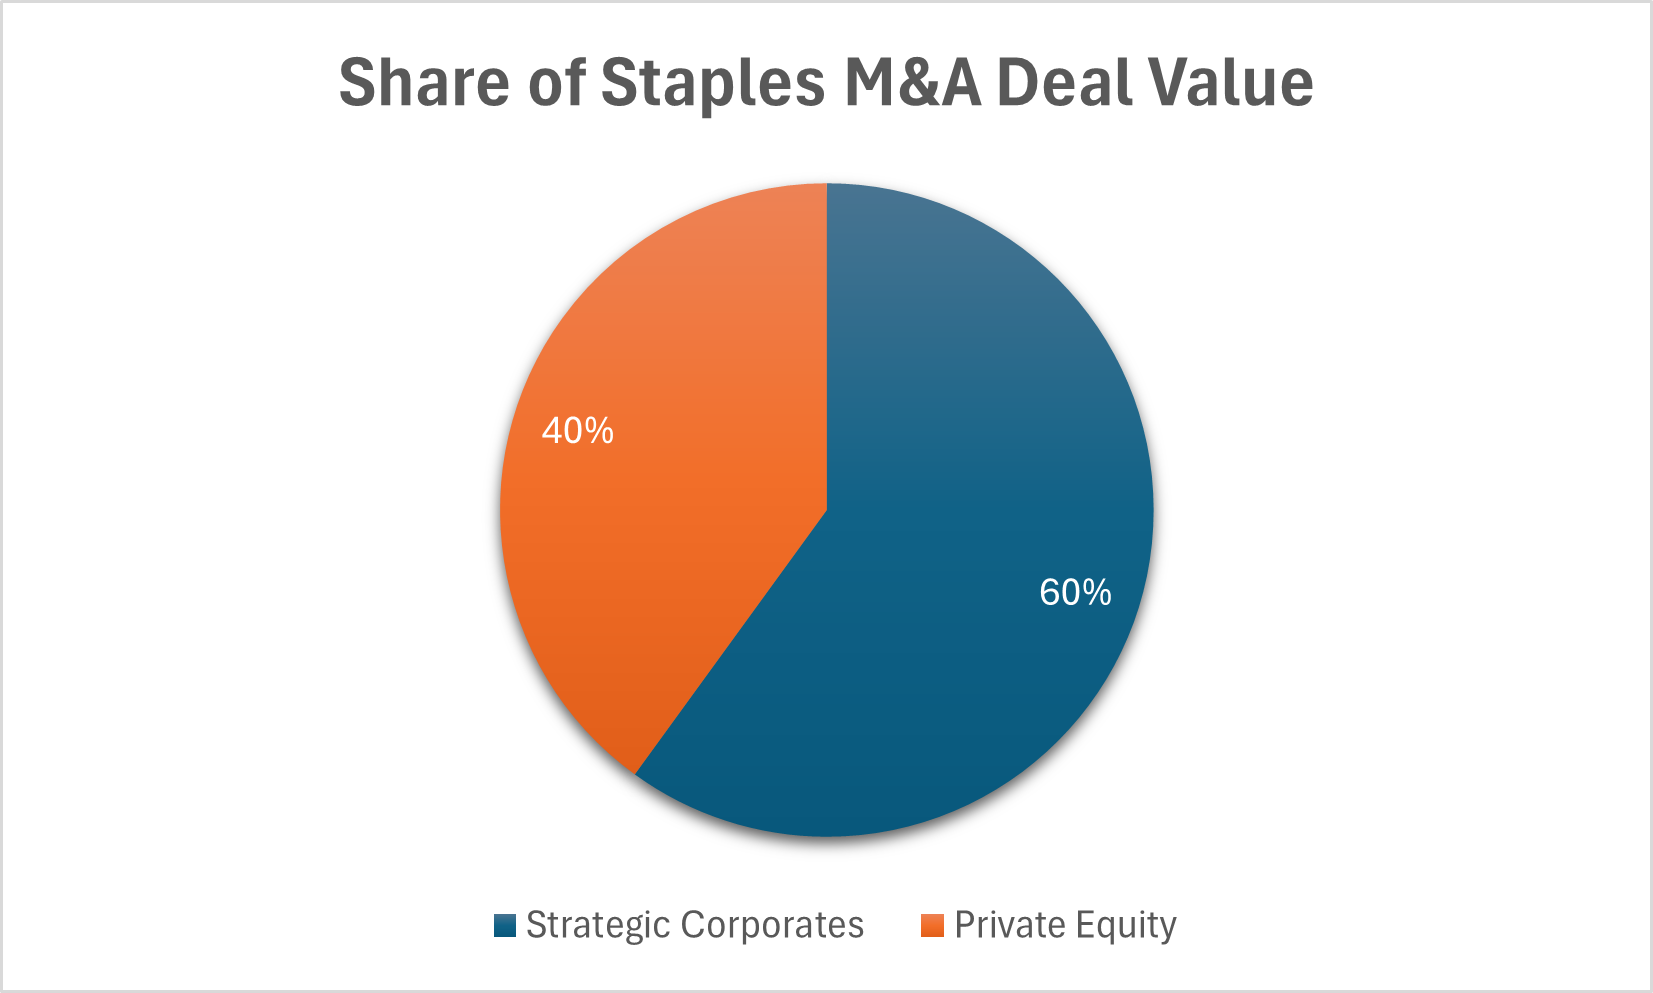
Buyer composition of consumer staples M&A deal value shows elevated participation from private equity, consistent with transactions centered on margin improvement, portfolio rationalization, and operational restructuring
From a valuation perspective, the gap was clear. Prior to the announcement, TreeHouse traded at a forward earnings multiple materially below sector peers despite comparable long term cash flow potential. Private equity sponsors, operating with longer investment horizons, were willing to underwrite operational improvements in supply chain efficiency and product mix that public investors were unwilling to wait for.
The market reaction was immediate and discrete. On the announcement day, the share price jumped sharply and then stabilized near the offer level in subsequent sessions. Graphically, this appears as a step change followed by flat trading. This shape is significant. It indicates a clean repricing of intrinsic value rather than improving fundamentals.
Such patterns are common in late cycle environments where public markets penalize complexity and private capital specializes in absorbing it.
What this means for the market
An increase in take private activity often signals that public equity markets are becoming overly focused on short term earnings clarity. For the broader market, this can act as a valuation release valve. Private equity steps in when volatility declines and financing stabilizes, reallocating assets toward owners with longer time horizons.
-
Global M&A activity & market content
Financial Times
Global M&A rebounds as dealmaking accelerates into late 2025
https://www.ft.comBain and Company
Global M&A stages strong rebound in 2025 with total deal value approaching 4.8 trillion dollars
https://www.bain.com/about/media-center/press-releasesS and P Global Market Intelligence
November 2025 ten billion dollar plus M&A deals set Q4 up to outpace the prior quarter
https://www.spglobal.com/market-intelligenceReuters Breakingviews
Global dealmaking momentum strengthens as financing conditions improve
https://www.reuters.comPrivate equity participation and buyer composition
S and P Global Market Intelligence
Global private equity deal value rises year over year in November 2025
https://www.spglobal.com/market-intelligenceAxios Pro Rata
Private equity remains a key driver of late cycle M&A activity in 2025
https://www.axios.comPwC
Global private equity and principal investor deal trends 2025
https://www.pwc.comHealthcare M&A specific context
Institute for Mergers Acquisitions and Alliances
Weekly global M&A activity including healthcare sector transactions November 2025
https://imaa-institute.orgFinancial Times
Healthcare M&A activity remains resilient amid regulatory and cost pressures
https://www.ft.comEY
Global healthcare M&A and life sciences deal outlook 2025
https://www.ey.comConsumer staples and TreeHouse Foods context
Financial Times
Consumer staples M&A driven by portfolio rationalization and margin focus
https://www.ft.comS and P Global Market Intelligence
Consumer products and food sector M&A activity late 2025
https://www.spglobal.com/market-intelligencePwC
Consumer markets deals outlook and private equity participation
https://www.pwc.com
AI & Tech Investments
Brief Overview
Artificial intelligence investment in November 2025 continued to shift away from early stage experimentation and toward large scale capital allocation decisions that increasingly resemble past infrastructure and industrial cycles. The defining feature of the month was not innovation headlines but the growing cost and complexity of deploying AI at scale. Computing intensity power availability financing capacity and supply chain coordination now shape investment outcomes more than model performance alone. As a result, market participants are beginning to differentiate between companies that benefit from sustained deployment and those whose earnings rely on continued hype. This transition matters because it changes how investors should think about risk durability and valuation heading into 2026.
AI Infrastructure spending becomes a balance sheet driven cycle
By late 2025 AI infrastructure spending had reached a scale where it materially affects corporate balance sheets and capital markets. Global data center investment accelerated sharply through the year with total data center related deal value reaching roughly 61 billion dollars by November which exceeded the full year record set in 2024. At the same time operating investment continued to rise. Industry estimates show worldwide data center capital expenditures increased by approximately 59% year over year in the third quarter of 2025 marking multiple consecutive quarters of elevated growth. This level of spending is historically associated with periods where infrastructure demand is driven by long term utilization expectations rather than short term cycles.
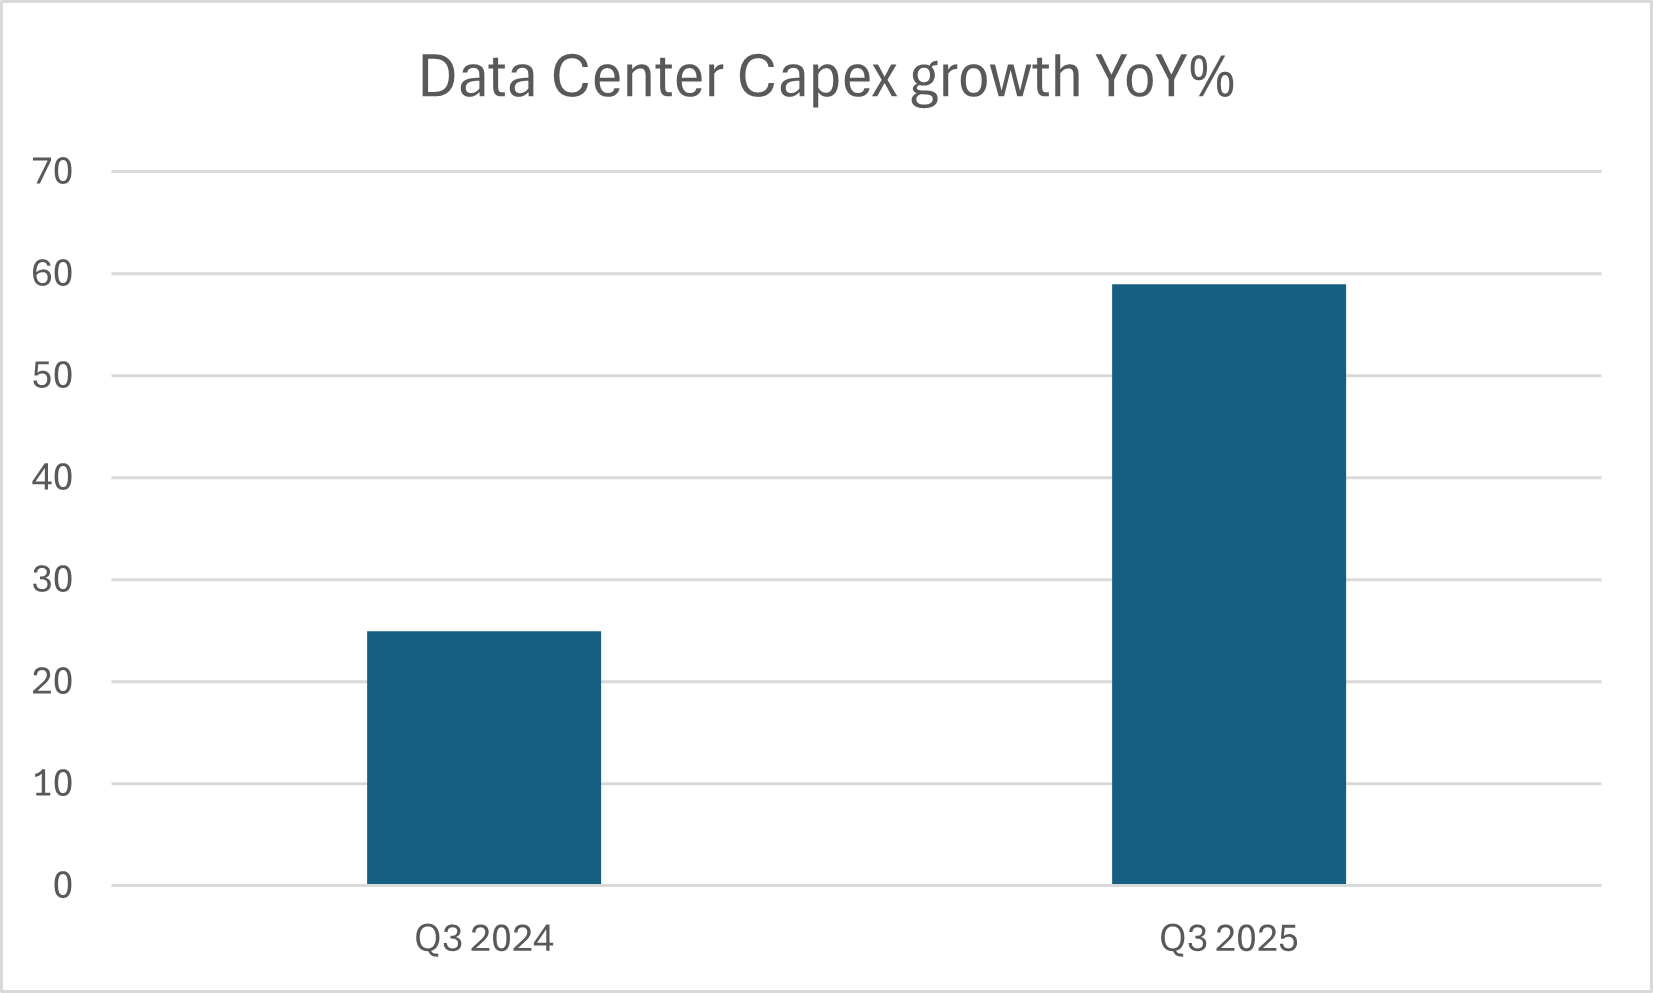
Worldwide data center capital expenditures rose 59% year over year in Q3 2025, reinforcing that AI deployment is driving a sustained infrastructure spending cycle rather than a short demand spike
The financing side reinforces this interpretation. Hyperscale cloud providers and infrastructure owners collectively issued over 120 billion dollars of debt in 2025 largely to fund AI related buildouts. This indicates that firms are committing to multi year deployment rather than testing demand. Debt funded expansion increases both upside and risk. If utilization remains high fixed costs are absorbed efficiently and margins expand. If demand growth slows before assets are fully deployed returns compress quickly. Markets are therefore beginning to distinguish between assets with contracted revenues and those dependent on spot demand.
For public markets this means AI exposure increasingly resembles a utilities or infrastructure trade rather than a pure growth trade. Companies with long term contracts predictable pricing and access to low cost capital are positioned to benefit even if equity multiples compress. Conversely firms relying on rapid demand growth to justify aggressive expansion face higher downside risk. The investment takeaway for students is that AI infrastructure winners are increasingly determined by financing structure and cost discipline not just technological leadership.
Okay, now what. Investors should monitor three indicators through early 2026. First whether data center capex growth remains above 30% year over year since sustained growth at that level signals confidence in long term demand rather than speculative overbuild. Second whether debt issuance remains orderly as widening credit spreads would raise funding costs and pressure returns. Third whether transaction volumes remain high without aggressive valuation inflation which would indicate capital is still being allocated selectively rather than indiscriminately.
Semiconductor investment shifts from chip scarcity to system constraints
The semiconductor cycle supporting AI has entered a more complex phase. Early in the cycle the bottleneck was access to advanced chips. By late 2025 constraints had shifted toward system level components such as advanced packaging high bandwidth memory testing capacity and networking integration. Global semiconductor equipment spending reflects this transition. Industry projections estimate total semiconductor equipment sales of approximately 133 billion dollars in 2025 with spending expected to rise toward 156 billion dollars by 2027. Importantly the fastest growth is occurring in back end segments. Test equipment spending is projected to rise more than 48% in 2025 while assembly and packaging equipment spending is expected to increase close to 20%.
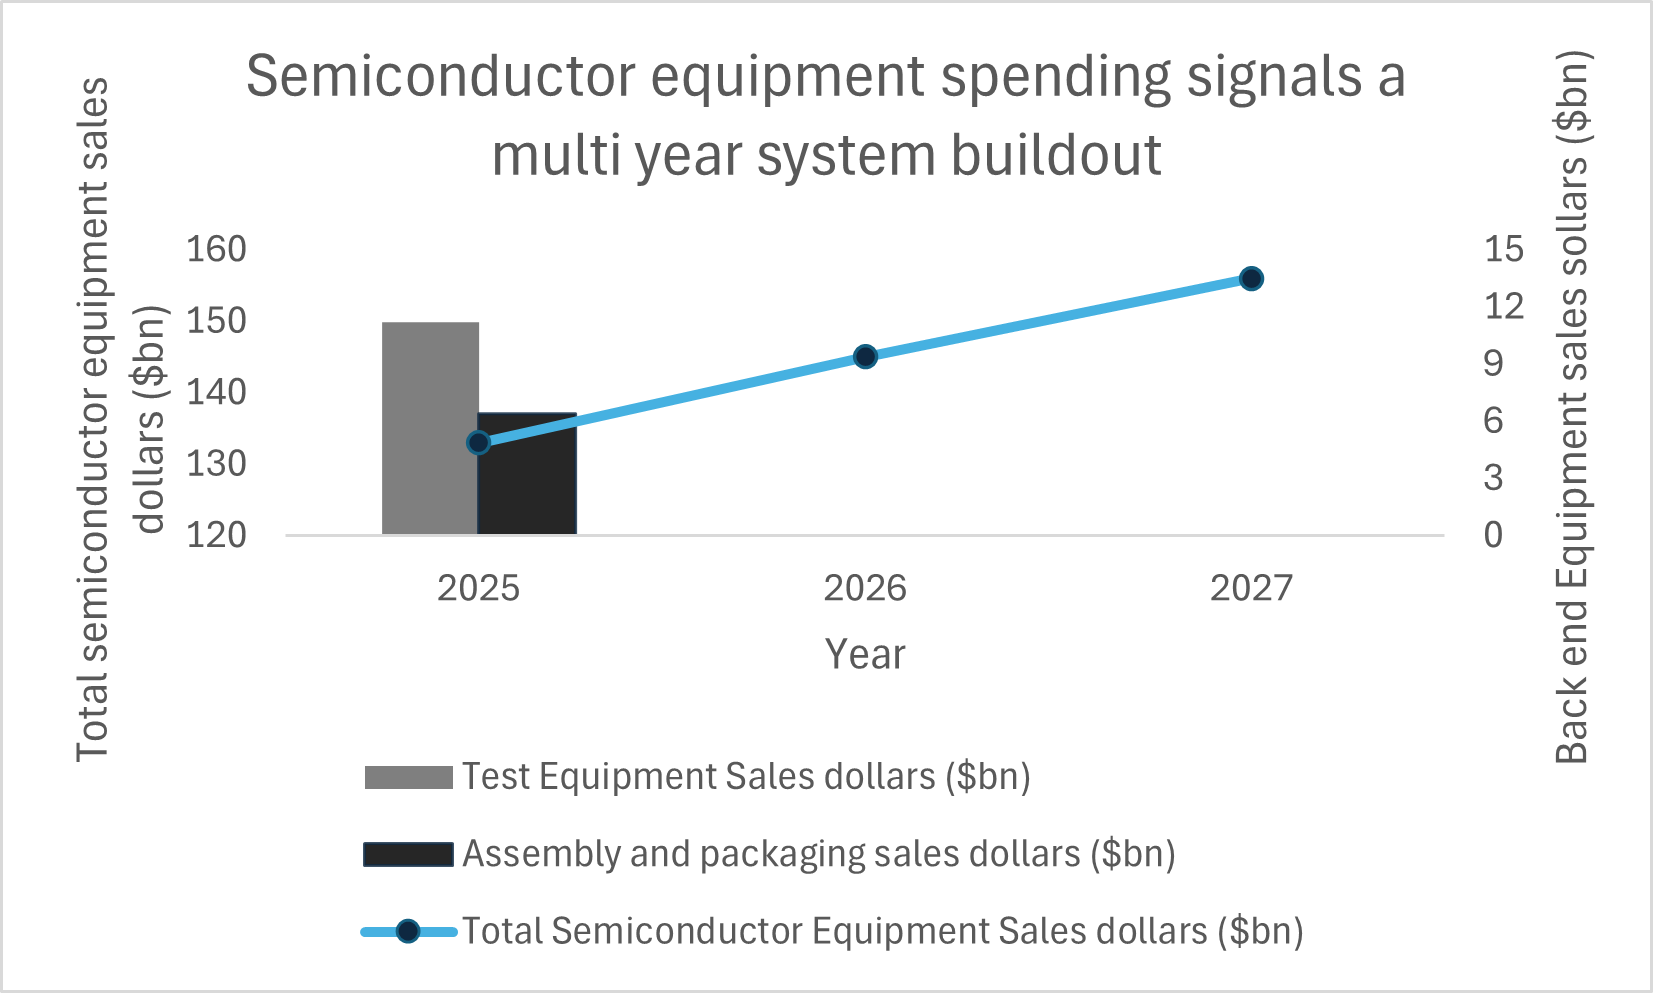
SEMI projects total semiconductor equipment sales rising from 133 billion dollars in 2025 to 156 billion dollars by 2027. Back end investment in testing and assembly and packaging in 2025 highlights the system level constraints emerging as AI deployment scales
This matters because it indicates that AI demand is moving beyond initial wafer production into full system deployment. Advanced packaging and testing become critical only when chips are being integrated into complex systems at scale. That suggests the industry is solving throughput problems rather than merely stockpiling capacity. For markets this implies a broader earnings opportunity set but also greater selectivity. Not all semiconductor firms benefit equally. Companies exposed to packaging memory integration and validation infrastructure may see earnings upgrades even as front end equipment demand normalizes.
There is also a geopolitical dimension. Back end capacity expansion is increasingly tied to regional industrial policy and export control considerations. Investment decisions are influenced not only by demand but also by supply security. This increases dispersion within the sector as firms aligned with policy priorities gain visibility while others face constraints.
Okay, now what. The key question for 2026 is whether equipment spending is translating into deployed and monetized systems. Sustained growth in back end spending would confirm that AI systems are being installed and used productively. A slowdown in these segments while headline AI demand remains strong would signal that constraints such as power availability financing or integration complexity are limiting real world deployment. For students this highlights why following only GPU headlines gives an incomplete picture of the AI cycle.
Private market AI funding grows rapidly but becomes more concentrated
Private market investment in AI continued to expand rapidly in 2025 but November data highlight an important shift toward concentration. AI related private market deal value reached approximately 55 billion dollars in the third quarter alone and total AI funding for 2025 exceeded 200 billion dollars which represents an increase of more than 75% from the prior year. At the same time funding is increasingly dominated by a small number of large transactions. In the third quarter four deals accounted for roughly 46% of all AI venture capital deal value.
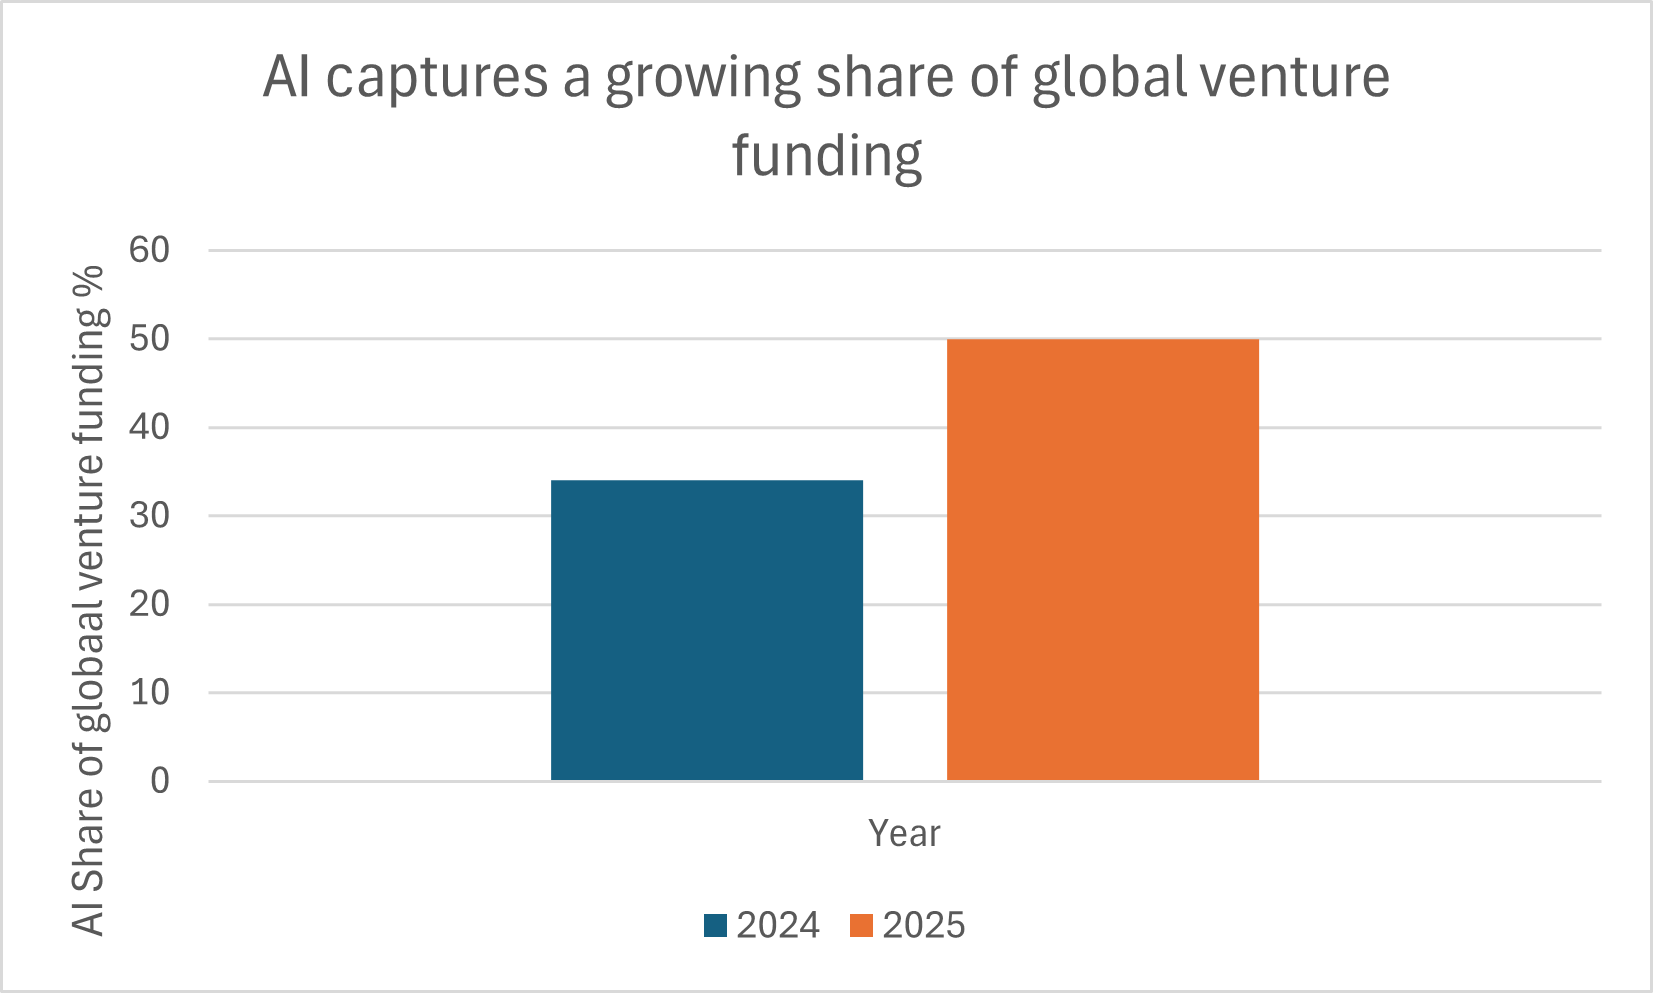
AI accounted for approximately 50% of global venture capital funding in 2025, up from roughly 34% in 2024. This sharp increase shows that investor conviction in AI has continued to strengthen even as overall private market activity remains selective. The data suggests that capital is not broadly returning to risk, but instead concentrating in sectors with clear revenue potential, scalability, and strategic importance. For markets, this reinforces the idea that AI is no longer a niche growth theme but a core driver of capital allocation across technology and private markets heading into 2026
This concentration has meaningful implications. On one hand it provides well capitalized firms with the resources to commit to long term infrastructure contracts which supports demand for data centers chips and power. On the other hand it suggests that investors remain uncertain about broad based monetization and prefer to concentrate capital in perceived category leaders. For public markets this increases outcome dispersion. Valuations begin to reflect assumptions that winners are already known which can lead to sharp repricing if expectations shift.
From a learning perspective this illustrates that high aggregate investment does not always imply a healthy competitive landscape. Capital can be abundant while opportunity remains narrow. That dynamic often precedes periods where markets reassess long term profitability rather than growth potential alone.
Okay, now what. Students should watch whether funding begins to spread toward application layer and vertical specific AI companies. Broader funding distribution would signal clearer revenue pathways and support a wider set of public market beneficiaries. Continued concentration would indicate that monetization remains uncertain and that infrastructure demand is being driven by a limited number of players. This distinction will shape earnings sustainability across the AI ecosystem.
-
Reuters
AI boom drives data center dealmaking to record high says report December 19 2025
https://www.reuters.com/business/ai-boom-drives-data-center-dealmaking-record-high-says-report-2025-12-19Light Reading Dell Oro Group
Data center capex up 59 on continued AI investment in third quarter 2025
https://www.lightreading.com/data-centers/data-center-capex-up-59-on-continued-ai-investment-in-3q-2025-dell-oroSEMI
Global semiconductor equipment sales projected to reach a record of 156 billion dollars in 2027
https://www.semi.org/en/semi-press-release/global-semiconductor-equipment-sales-projected-to-reach-a-record-of-156-billion-dollars-in-2027-semi-reportsPitchBook
AI private market and venture capital trends Q3 2025
https://pitchbook.com/news/reports/q3-2025-ai-vc-trendsPitchBook
Just four deals made up nearly half of AI venture capital funding in Q3 2025
https://pitchbook.com/news/articles/just-4-deals-made-up-nearly-half-of-ai-vc-funding-in-q3Crunchbase News
Big funding trends charts end of year 2025 AI funding
https://news.crunchbase.com/ai/big-funding-trends-charts-eoy-2025
Geopolitical Shifts and Global Risk
Geopolitical risk remained structurally elevated in November 2025, yet its impact on global financial markets continued to evolve in a more nuanced and selective way. Rather than producing broad based risk off behavior, geopolitical developments increasingly influenced capital allocation through specific channels such as defense spending supply chain reconfiguration energy security and trade policy. Markets appeared more resilient to headlines but more sensitive to how geopolitical tensions translate into fiscal decisions corporate costs and long term investment patterns. This shift suggests that geopolitics is no longer priced as an episodic shock, but as a persistent condition shaping relative performance across sectors and regions heading into 2026.
One of the clearest signals of this normalization was the continued disconnect between geopolitical risk indicators and market volatility. Despite ongoing conflicts in Eastern Europe and the Middle East, equity volatility remained subdued throughout November. The VIX index averaged near 14 during the month, well below its long run average of approximately 20. At the same time, news based geopolitical risk indices remained elevated relative to pre pandemic levels, reflecting sustained conflict coverage and policy uncertainty. The coexistence of high geopolitical risk and low volatility indicates that investors no longer expect these tensions to spill over into immediate systemic disruption. Instead, markets appear to assume that conflicts will remain contained geographically, with economic effects unfolding gradually rather than abruptly.
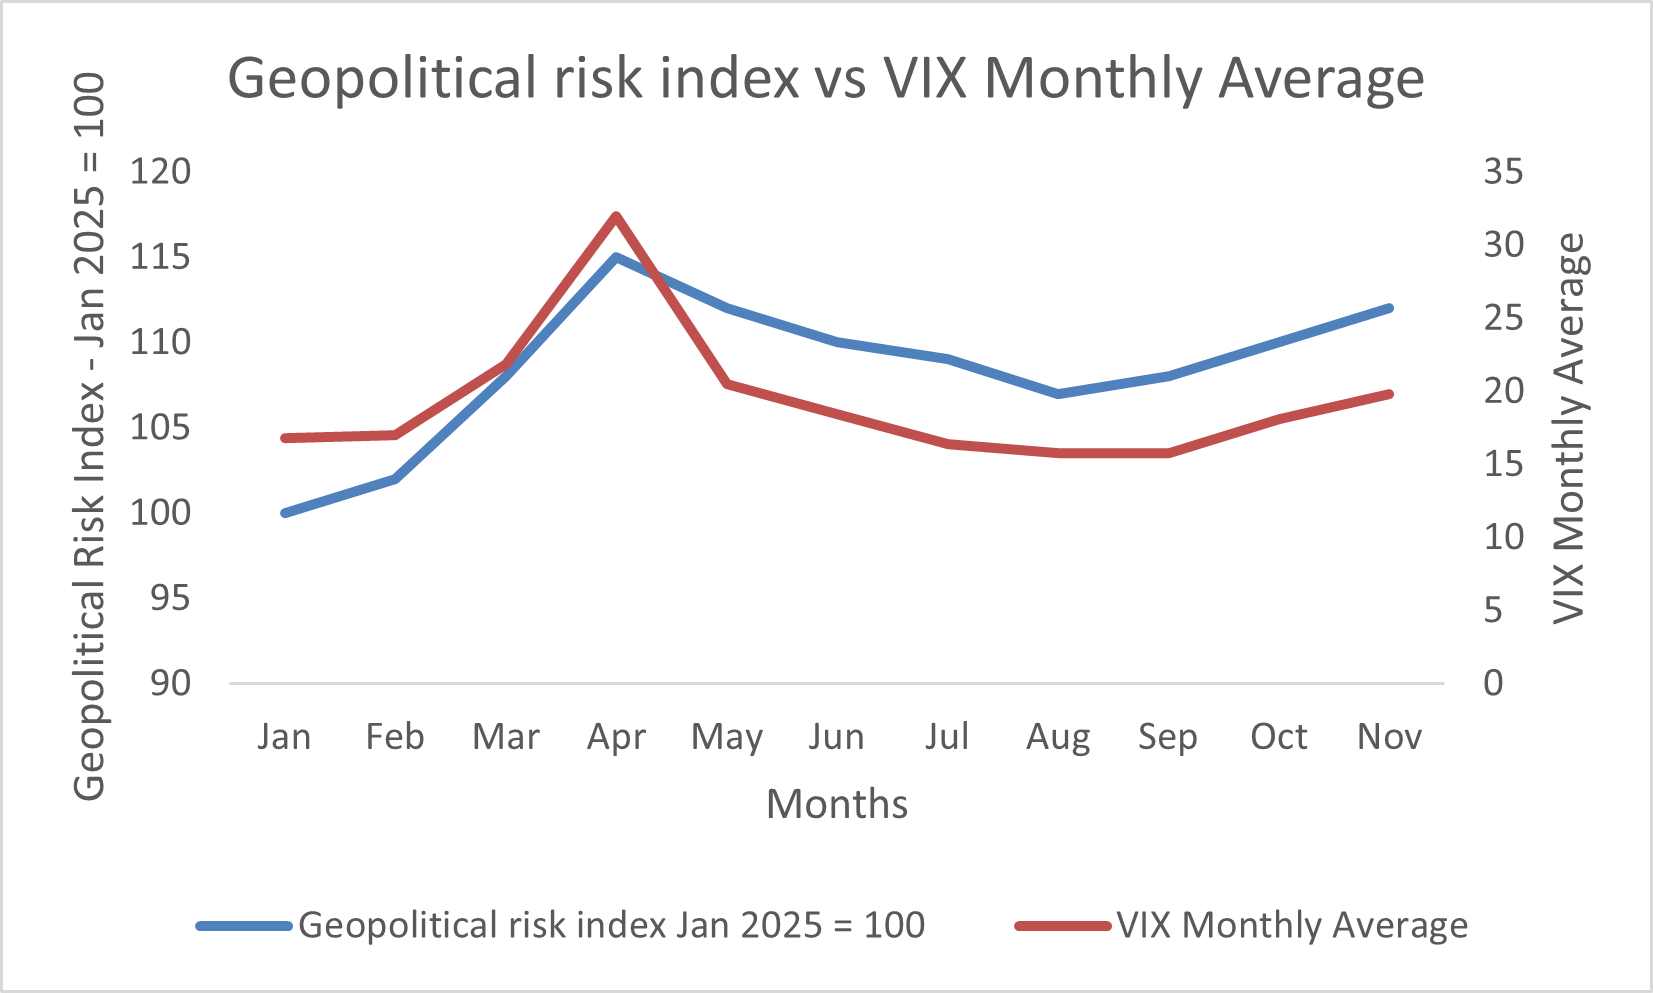
Geopolitical risk remained elevated through 2025 while the VIX stayed below its long run average, suggesting that markets treated geopolitical tensions as a persistent backdrop rather than an immediate systemic shock
Fixed income and credit markets reinforced this interpretation. Long term government bond yields declined through November while credit spreads tightened, signaling that investor focus remained centered on slowing growth and disinflation rather than escalation risk. There was no broad flight into traditional safe havens such as cash or gold driven purely by geopolitical developments. Instead, capital flowed selectively toward sectors perceived to benefit from geopolitical conditions. This pattern highlights an important market lesson. Risk is not being ignored, but it is being priced through relative winners and losers rather than through wholesale de risking.
Defense and security spending provides the most tangible example of how geopolitical risk is translating into economic outcomes. Global defense spending reached an estimated 2.4 trillion dollars in 2025, representing a sustained increase from pre pandemic levels. NATO members on average exceeded the 2% of GDP defense spending benchmark, with several European governments committing to multi year procurement programs covering ammunition air defense cyber capabilities and logistics. These commitments are not short term stimulus measures. They reflect long duration fiscal decisions that create predictable demand for defense suppliers over many years.
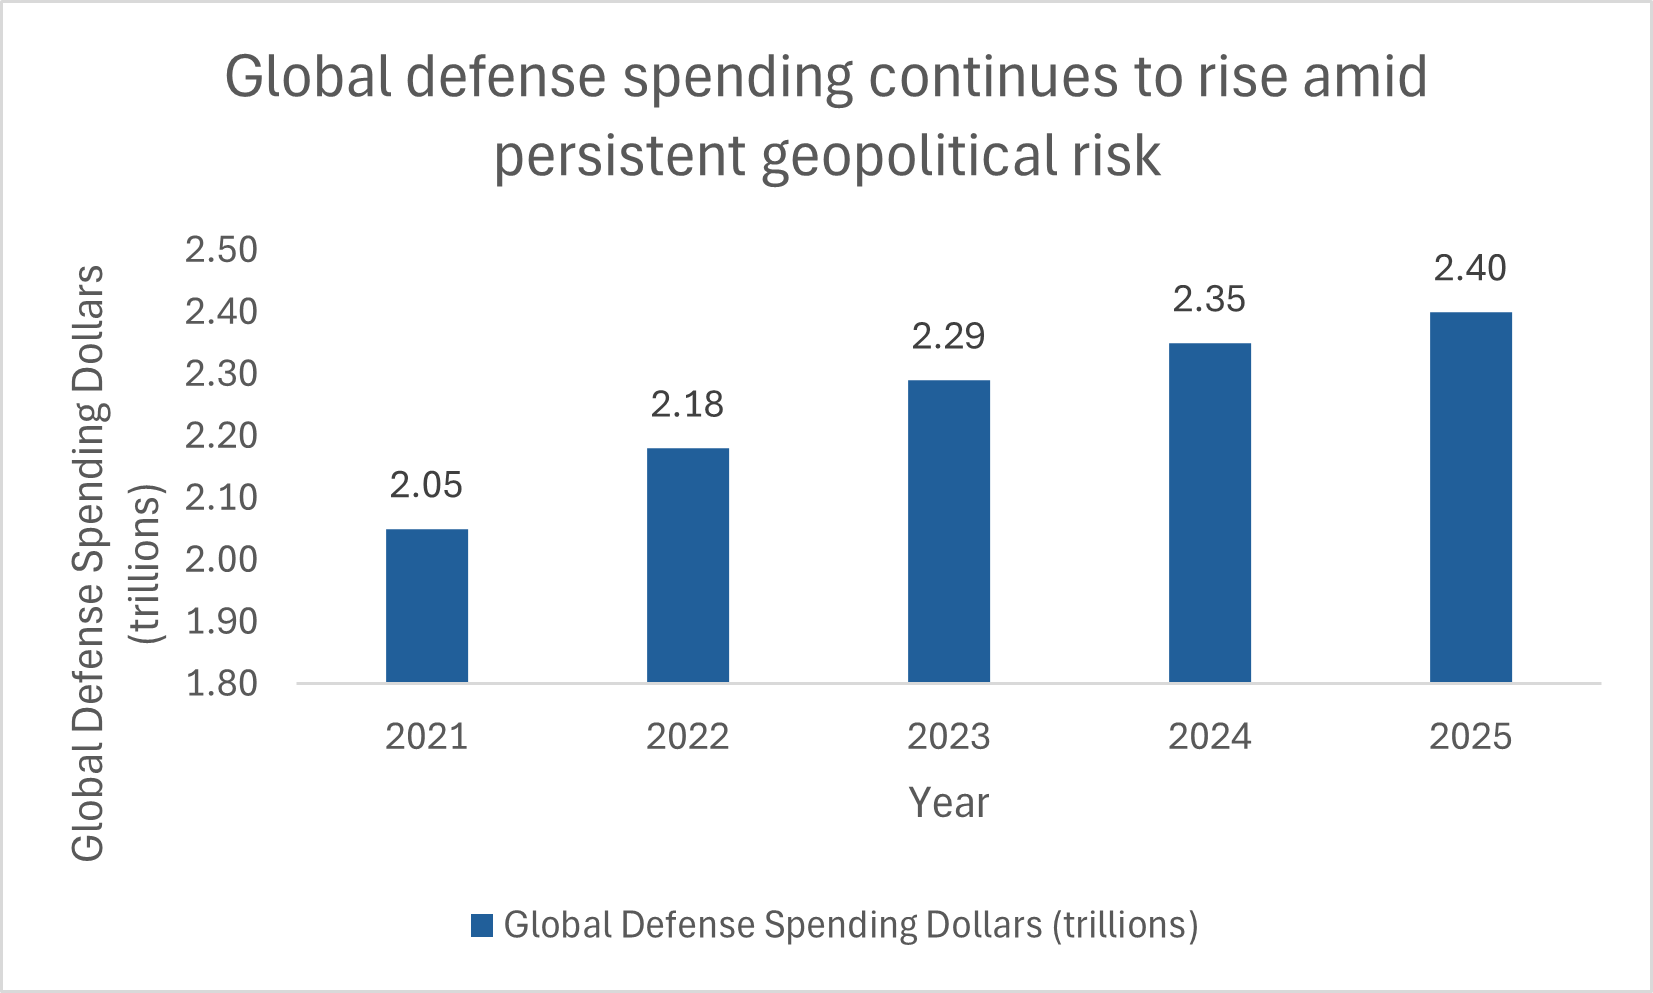
Global defense spending reached approximately 2.4 trillion dollars in 2025, reflecting sustained increases in military and security investment as geopolitical risk becomes embedded in long term fiscal planning
Equity markets responded accordingly. Defense and aerospace companies outperformed broader indices during periods of heightened uncertainty, supported by long term government contracts and strong backlog visibility. Unlike cyclical industries, defense spending is less sensitive to interest rate movements and short term growth fluctuations. This makes the sector structurally attractive in an environment where geopolitical risk persists even as macroeconomic momentum moderates. At the same time, rising defense budgets contribute to higher structural deficits in some economies, underscoring that geopolitical risk increasingly feeds into fiscal sustainability debates rather than just market sentiment.
Trade and supply chain dynamics represent another channel through which geopolitical risk is reshaping global markets. While global trade growth remained positive, it continued to lag pre pandemic trends. At the same time, trade and investment within geopolitical blocs intensified. Corporations accelerated efforts to diversify supply chains toward regional manufacturing hubs such as Southeast Asia Mexico and parts of Eastern Europe, reducing reliance on single country production. Foreign direct investment data shows a rising share of capital directed toward geopolitically aligned partners rather than purely cost optimized locations.
This reconfiguration does not imply a collapse in globalization. Instead, it signals a shift toward a more fragmented and regionalized system. Export controls tariffs and compliance requirements have raised operating costs and reduced efficiency for some firms, while others benefit from proximity to end markets and policy alignment. Over time, these changes alter cost structures margins and return on invested capital. Markets have begun to reward firms with flexible supply chains pricing power and regional scale while assigning higher risk premia to companies with concentrated or geopolitically exposed production footprints.
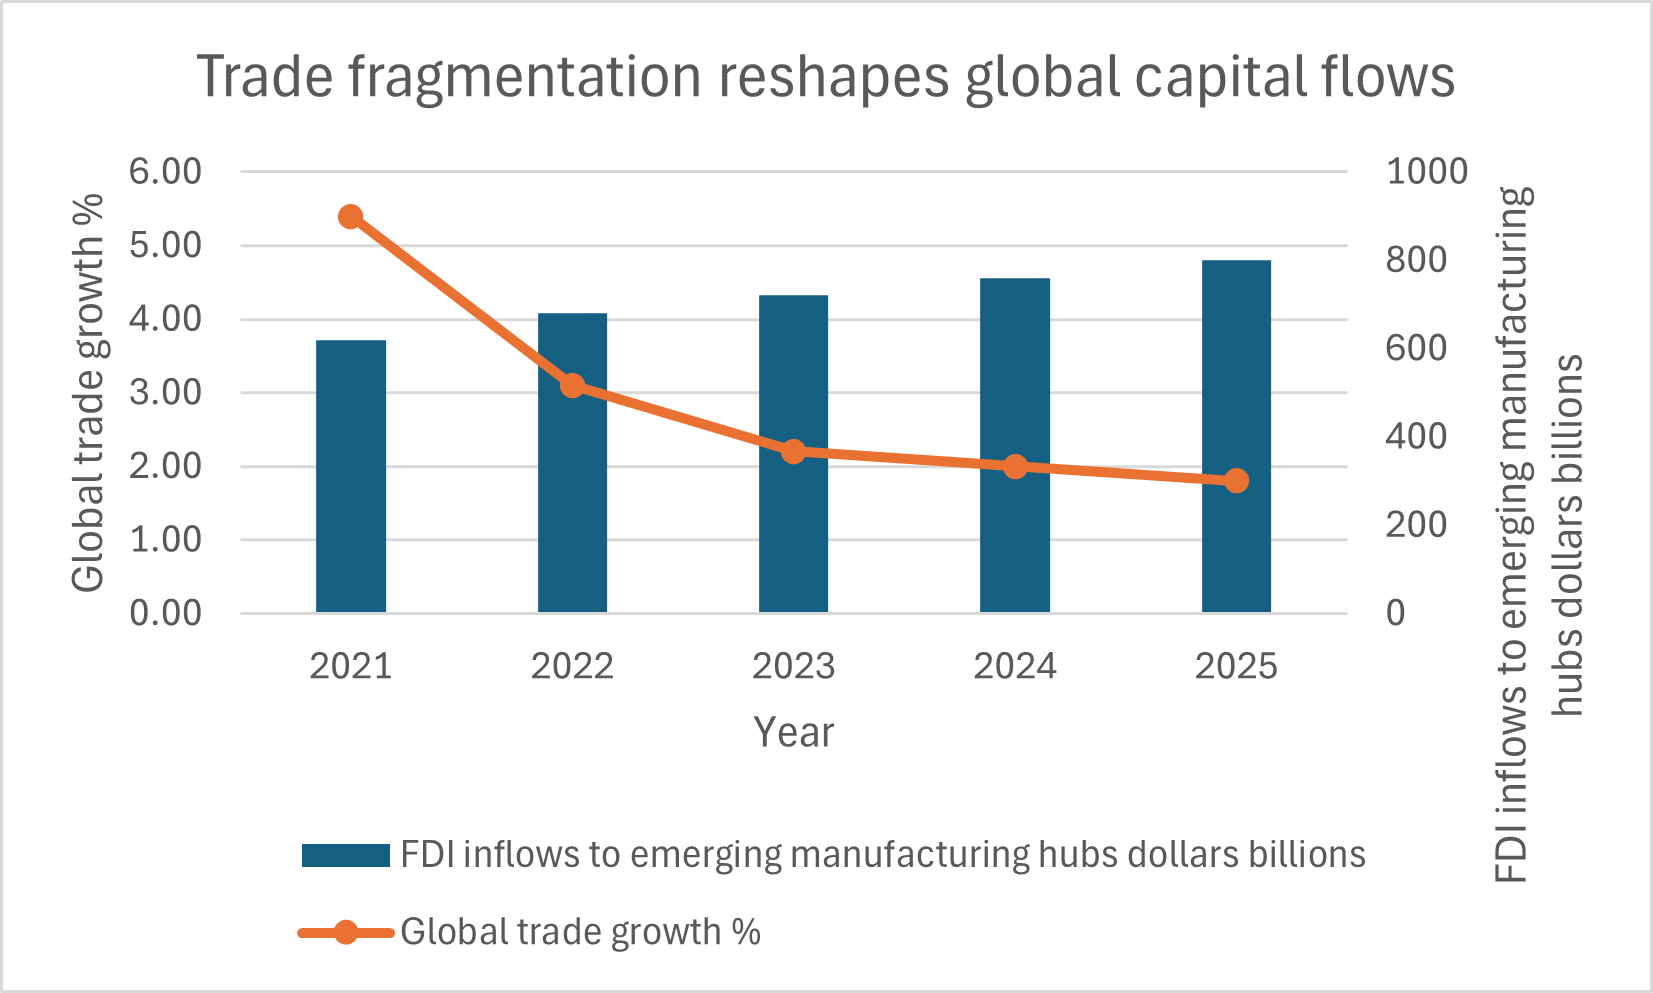
Slowing global trade growth alongside rising foreign direct investment into regional manufacturing hubs highlights how geopolitical fragmentation is reshaping capital allocation rather than reversing globalization outright
Taken together, November’s data suggests that geopolitical risk is being absorbed into the market framework rather than sitting outside it. Volatility remains contained not because risks have disappeared, but because investors believe the economic transmission of these risks will be gradual and uneven. The key implication for markets heading into 2026 is that geopolitical developments are more likely to influence sector leadership fiscal dynamics and supply chain strategy than to trigger abrupt global selloffs.
Hence, investors should focus less on headline geopolitical events and more on how those events translate into sustained fiscal commitments trade policy adjustments and corporate investment decisions. For students, this section illustrates that global risk is increasingly about structural adaptation rather than short term shocks. The ability to identify which sectors and business models benefit from this environment will matter more than attempting to time volatility spikes driven by headlines.
What To Watch Next Month
December will be defined by whether the easing narrative can hold as markets move from hopeful positioning into harder evidence. The first focus is central bank communication and the degree to which policymakers validate market pricing without committing to an aggressive cutting cycle. Investors are already leaning toward rate cuts beginning in 2026, but that expectation depends on continued improvement in services inflation and wages. Any guidance that keeps policy restrictive for longer would likely raise term premiums, pressure long duration equities, and slow the tightening in credit spreads that supported risk assets through November.
Inflation and labor market prints will be the main inputs into that policy debate. Markets will pay less attention to headline inflation swings and more to core services and wage growth, particularly in North America and the Eurozone. The key question is whether recent disinflation reflects genuine cooling in demand or whether it is being carried by goods and base effects while services remain sticky. If services inflation prints firm again, rate expectations could be pushed further out, which would test the valuation support that lower yields provided to growth and AI linked equities.
Earnings revisions and guidance into year end will form the second pillar of the month. Equity performance in 2025 has been concentrated in a narrow group of large cap companies tied to AI infrastructure and digital platforms. December will bring more attention to whether that earnings strength is broadening or remaining confined. Analysts will watch if industrial automation, defense supply chains, and select cyclicals are seeing upgrades, since broader earnings participation would reduce concentration risk and make the equity rally more durable. If revisions continue to cluster around a handful of firms, markets remain vulnerable to sharp repricing when any single earnings story disappoints.
Geopolitical risk will remain elevated, but the more important question is how it translates into financial variables. November showed that volatility can stay low even when geopolitical tension is high. December will test that stability if escalation raises energy risk premiums, disrupts shipping routes, or forces sharper fiscal commitments. Monitoring the relationship between geopolitical indicators and the VIX remains useful, but an even clearer signal is whether credit spreads widen and whether safe haven demand increases meaningfully. A rise in volatility without a tightening in financial conditions would imply headline sensitivity, while a joint move in volatility and credit would imply deeper risk repricing.
Trade and supply chain developments will provide another structural lens. Firms have been reallocating supply chains toward regional hubs and geopolitically aligned partners, a shift that changes margins and capital expenditure plans over time. December data on export orders, FDI announcements, and industrial output will help indicate whether this reallocation is accelerating. A continuation of weak global trade growth alongside rising regional investment would reinforce the thesis that fragmentation is reshaping capital allocation rather than ending globalization.
Energy markets round out the watch list. Oil traded in a narrow range through November, but clarity around OPEC plus positioning for early 2026 could shift expectations quickly. The market is balancing modest demand growth against uncertain supply discipline. A stable oil price range would support the disinflation narrative, while a renewed move higher would complicate central bank messaging and create a tighter constraint on rate cuts.
December will be less about new themes and more about validation. Markets are positioned for cooling inflation, gradual easing, and stable risk conditions. The key question is whether incoming data and policy signals confirm that setup or force investors to reprice the timing and certainty of the next easing cycle.
Closing Remarks
November closed with markets leaning into a constructive narrative. Disinflation across major economies continued to progress, long term yields moved lower, and risk assets responded with a renewed bid. Equities reflected this shift most clearly, while credit markets tightened further and funding conditions stayed supportive. The month also reinforced a key lesson for students of markets. Price action is often driven less by what the data says in isolation and more by how it changes expectations for the future path of policy, growth, and corporate earnings.
At the same time, several underlying dynamics suggest that the next phase of the cycle will reward selectivity more than broad optimism. Equity returns remain concentrated in a narrow group of firms tied to AI infrastructure and durable earnings visibility. Fixed income performance has improved as duration rallied, yet credit spreads are already tight and leave less room for further compression without stronger growth. In commodities, energy stayed range bound, signalling that supply conditions and producer coordination mattered more than geopolitical headlines. These cross asset signals point to an environment where investors are not pricing an immediate downturn, but are also not paying the same premium for risk across the board.
Geopolitics continues to function as a structural input rather than a short term shock. Volatility remained subdued even as geopolitical risk stayed elevated, but the economic transmission of these tensions is becoming more visible through defense spending, supply chain reconfiguration, and trade policy. This is a shift worth emphasizing. Markets can absorb persistent geopolitical stress when the effects are gradual and when liquidity and policy expectations remain supportive. The investment challenge is identifying where these pressures create long duration winners and where they quietly raise costs and risk premia for exposed sectors.
Heading into year end, the most important question is whether the easing narrative can hold without a renewed flare up in services inflation or a sharper slowdown in activity. If inflation continues to cool while growth remains resilient, markets may sustain their risk on posture into early 2026. If services inflation stays sticky or if earnings revisions begin to soften outside of a small group of leaders, dispersion is likely to widen and volatility may return through sector rotation rather than broad selloffs.
The takeaway from November is that the cycle is shifting from a pure macro story to a more structural one. Policy expectations still matter, but market leadership is increasingly being determined by balance sheet strength, pricing power, and exposure to long duration investment themes such as AI infrastructure, defense, and supply chain restructuring. The ability to connect macro conditions to these sector level outcomes will remain the most valuable skill as markets move into the next stage of this cycle.