
Monthly Market Memorandum - December 2025
Contents
Executive Summary
Macro & Market Overview
2.1 Inflation & Rates
2.2 Global Economic Activity
2.3 Equity Markets
2.4 Fixed Income & Credit
2.5 Commodities & Alternatives
Key Themes of the Month
3.1 The Repricing of Duration Risk
3.2 Credit Markets as the Shock Absorber
3.3 Global Growth and Capital Allocation
What to Watch Next Month
Closing Remarks
Executive Summary
December 2025 saw relatively calm market moves, with small changes in equity prices, slightly higher long term interest rates, and continued strength in credit markets. US equities finished the month close to where they started, but shifts underneath the surface showed that interest rates and financing conditions still played an important role in market behavior.
The S&P 500 increased 0.48% in December, closing at 6,845.50 on December 31 compared with 6,812.63 at the start of the month. Over the same period, the Nasdaq Composite declined 0.15%, ending December at 23,241.99 versus 23,275.92 on December 1. The difference in performance between the two indices reflected pressure on technology and other long term growth stocks as longer term interest rates moved higher, while broader large cap stocks remained more stable.
Interest rate movements were modest but meaningful. The 10 year US Treasury yield increased from 4.09% at the start of December to 4.18% by month end, a rise of 9 basis points. At the same time, the 2 year Treasury yield fell from 3.54% to 3.47%, a decline of 7 basis points. This combination slightly reduced the gap between short term and long term rates. Higher long term yields tend to reduce the value of stocks whose profits are expected further in the future, which helps explain the weaker performance of the Nasdaq relative to the S&P 500 even though overall market moves were small.
Credit markets continued to show strength, suggesting that investors were still comfortable taking risk. US investment grade corporate bond spreads tightened from 0.82% at the start of the month to 0.79% at month end. US high yield spreads tightened more meaningfully, falling from 2.94% to 2.81%. Tightening spreads indicate that investors required less extra return to hold corporate debt relative to government bonds, which points to confidence in corporate balance sheets and economic conditions. This helped keep financial conditions supportive even as longer term interest rates rose.
Commodity prices moved lower, led by energy. West Texas Intermediate crude oil prices fell from $59.47 per barrel on December 1 to $57.89 per barrel by December 29, the last available data point for the month, representing a 2.66% decline. Lower oil prices reduced near term inflation pressure and helped offset some of the impact of higher interest rates, although the move was not large enough to change the broader inflation picture on its own.
Three themes shaped how markets interpreted December’s data. First, merger and acquisition activity remained closely tied to interest rates and credit conditions, with higher long term rates making some deals harder to justify, while tight credit spreads continued to support financing availability. Second, investment in AI and technology remained sensitive to changes in long term rates, as even small yield increases affected the relative performance of growth focused stocks. Third, geopolitical risk stayed in the background, influencing energy prices and risk sentiment without causing major market disruptions during the month.
Macro & Market Overview
Inflation & Rates
Inflation trends going into December 2025 continued to ease compared with earlier in the cycle, but progress remained uneven across regions and components. Most inflation data available by month end reflected November releases, meaning markets were reacting more to rate decisions and expectations than to fresh inflation prints. This disconnect helped explain why interest rates moved in different directions across the curve even as headline inflation remained close to central bank targets in several regions.
In the United States, headline CPI rose +2.7% year over year in November, down meaningfully from peak levels seen in 2022 and 2023. Core CPI, which excludes food and energy, was +2.6% year over year, suggesting that underlying inflation pressures had cooled but not fully returned to the Federal Reserve’s 2% target. Energy remained an important swing factor, with the energy index up +4.2% over the past 12 months, highlighting how commodity price moves can still influence short term inflation readings even when broader price pressures are slowing.
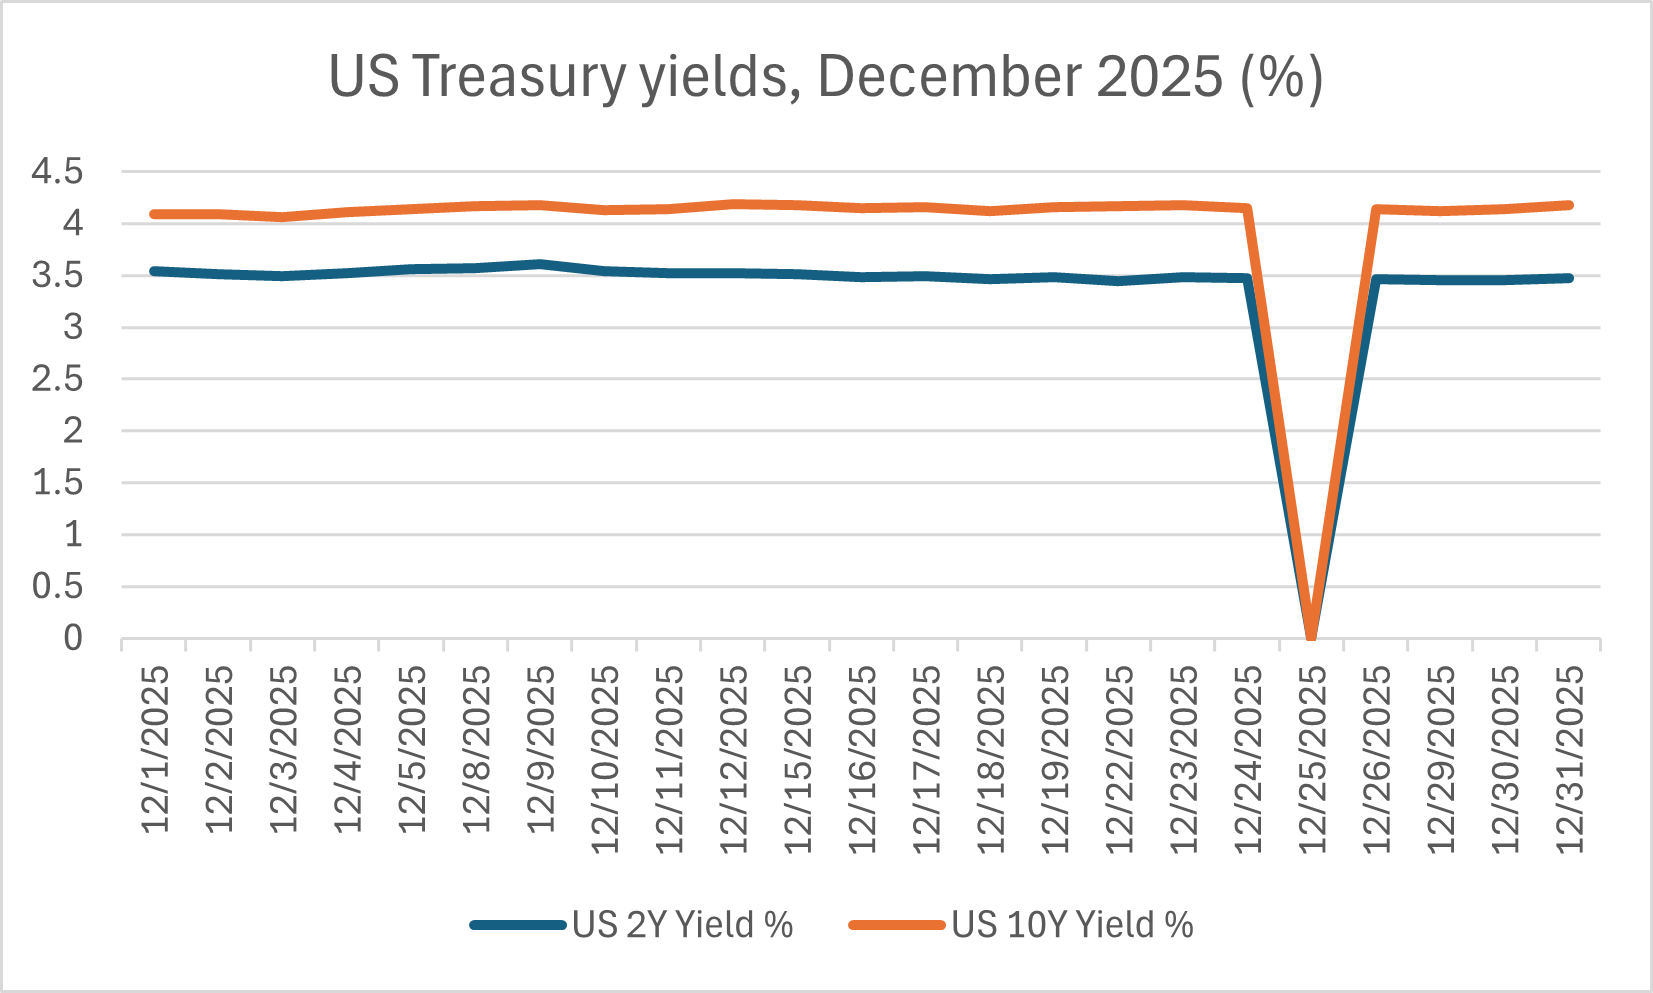
US Treasury yields, December 2025 (%)
This chart shows that following the December Federal Reserve rate cut, short term yields declined while long term yields moved higher. The 2 year yield fell from 3.54% to 3.47%, while the 10 year yield rose from 4.09% to 4.18%, resulting in a modest steepening of the yield curve.
Canada showed a similar pattern. November CPI was +2.2% year over year, close to the Bank of Canada’s target range. However, CPI excluding gasoline was higher at +2.6% year over year, indicating that non energy inflation remained stickier. Monthly CPI increased only +0.1% month over month, or +0.2% on a seasonally adjusted basis, pointing to slower price momentum heading into year end rather than renewed inflation acceleration.
Europe’s inflation picture continued to normalize. Euro area HICP inflation was +2.1% year over year in November, with a monthly decline of -0.3%. This reflected falling energy prices and weaker goods inflation, alongside slower economic growth across the region. Inflation outcomes close to target reduced pressure on the European Central Bank to tighten further, but did not immediately translate into aggressive easing expectations.
Japan remained the main outlier. Core inflation was +3.0% year over year in November, well above the levels seen in North America and Europe. Persistent wage growth and service price increases kept inflation elevated relative to Japan’s long term history, reinforcing the view that Japan had moved into a different inflation regime compared with the deflationary period that dominated the past two decades.
While inflation data mostly showed gradual cooling, interest rates in December were driven more by central bank actions and bond market dynamics. In the US, the Federal Reserve cut the target range for the federal funds rate to 3.50% to 3.75% at its December meeting, effective December 11. The policy cut reflected confidence that inflation had moved off its peak and that restrictive policy was no longer required at prior levels. However, Treasury yields did not move lower across the entire curve.
The 2 year US Treasury yield declined from 3.54% at the start of December to 3.47% by month end, reflecting expectations for lower policy rates ahead. In contrast, the 10 year Treasury yield rose from 4.09% to 4.18% over the same period. This resulted in a modest steepening of the yield curve, driven by higher long term yields rather than falling short term yields alone. Markets appeared to price stronger longer term growth or higher term premia even as near term policy became less restrictive.
Canada and Europe held policy rates steady through December. The Bank of Canada kept its overnight rate at 2.25%, while the ECB maintained its deposit facility rate at 2.00%. With inflation near target but not decisively below it, both central banks signaled caution rather than urgency. As a result, domestic bond yields in these regions were more influenced by global bond market movements than by local inflation surprises.
Japan moved in the opposite direction. The Bank of Japan raised its short term policy rate to around 0.75% from around 0.50%, continuing its gradual exit from ultra low rate policy. Japanese government bond yields rose alongside the decision, with the 10 year JGB yield reaching levels not seen in decades by late December. This shift mattered globally because Japan has historically been a source of low cost capital, and higher Japanese yields reduce incentives for capital to flow abroad in search of yield.
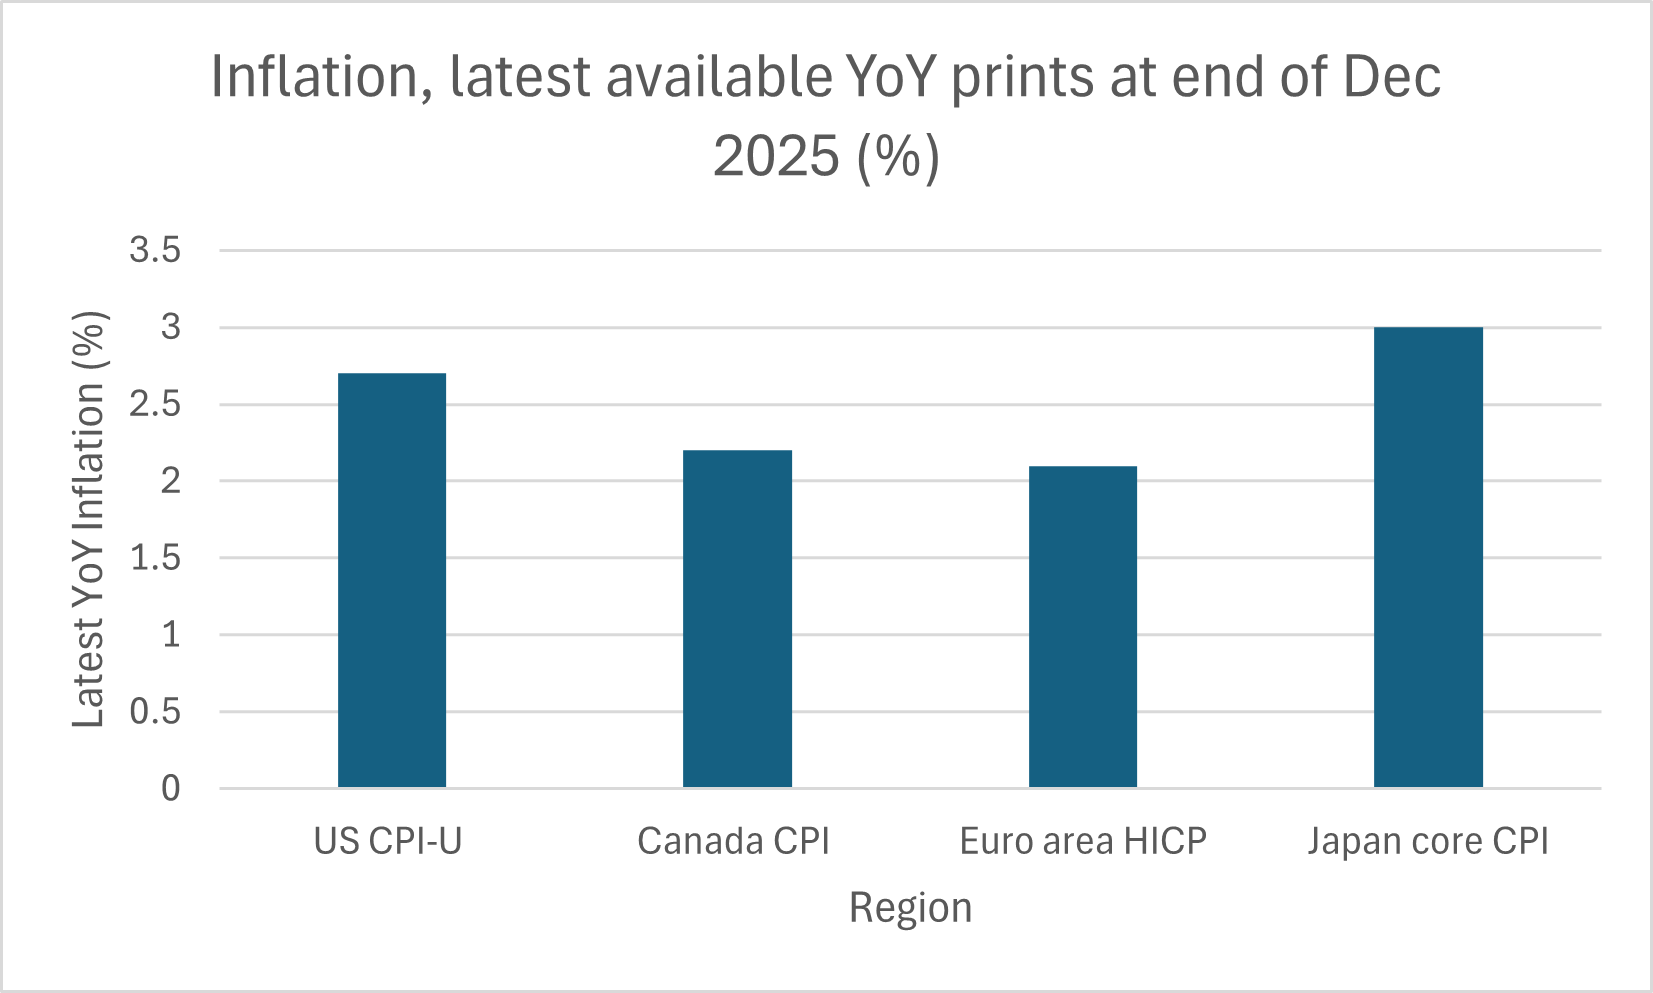
Inflation by region, latest available year over year data (%)
This chart compares the most recent year over year inflation readings available at the end of December 2025. Most figures reflect November releases. Inflation was near 2% in the US, Canada, and the euro area, while Japan remained higher at 3.0%.
For markets, December reinforced that falling inflation does not automatically mean falling long term interest rates. Policy rates eased or stabilized in most regions, but long term yields remained sensitive to growth expectations, supply of government bonds, and global capital flows. This environment continued to favor assets less sensitive to long term discount rates, while keeping pressure on long duration growth assets despite calmer inflation data.
Going into early 2026, inflation and rates are likely to remain closely linked but not move in lockstep. Inflation across the US, Canada, and Europe is already near central bank targets based on the latest available data, which reduces pressure for further tightening. However, inflation excluding energy remains above 2% in both the US and Canada, suggesting that central banks may be cautious about cutting rates too quickly.
For interest rates, the key uncertainty is whether long term yields follow policy rates lower or stay elevated. December showed that even with a Federal Reserve rate cut, the 10 year Treasury yield increased rather than declined. This suggests that bond markets are still pricing in stronger longer term growth, higher government borrowing, or persistent inflation risks. If long term yields remain high, assets that are sensitive to discount rates may continue to face pressure even if central banks ease policy further.
Japan’s policy shift also matters for the global rate outlook. Higher Japanese yields reduce the incentive for global investors to borrow in yen and invest abroad, which could limit downward pressure on global bond yields. As a result, early 2026 may see policy rates stabilizing or falling slowly, while long term yields remain more volatile and driven by global capital flows rather than near term inflation data alone.
-
Bureau of Labor Statistics Consumer Price Index Summary, November 2025
https://www.bls.gov/news.release/cpi.nr0.htm
Statistics Canada Consumer Price Index, November 2025
https://www150.statcan.gc.ca/n1/daily-quotidien/251215/dq251215a-eng.htmEurostat Euro Area Inflation Indicator, November 2025
https://ec.europa.eu/eurostat/web/products-euro-indicatorsReuters Japan Core Inflation, November 2025
https://www.reuters.com/world/asia-pacific/japans-core-inflation-steady-november-stays-above-boj-target-2025-12-18/Federal Reserve Implementation Note, December 2025
https://www.federalreserve.gov/newsevents/pressreleases/monetary20251210a1.htmFRED 2-Year Treasury Constant Maturity Rate (DGS2)
https://fred.stlouisfed.org/series/DGS2FRED 10-Year Treasury Constant Maturity Rate (DGS10)
https://fred.stlouisfed.org/series/DGS10Bank of Canada Policy Interest Rate
https://www.bankofcanada.ca/core-functions/monetary-policy/key-interest-rate/ECB Key Interest Rates
https://www.ecb.europa.eu/stats/policy_and_exchange_rates/key_ecb_interest_rates/html/index.en.htmlBank of Japan Monetary Policy Meeting Statement, December 2025
https://www.boj.or.jp/en/mopo/mpmdeci/mpr_2025/k251219b.pdf
Global Economic Activity
Global economic activity in December 2025 reflected a clear slowdown in momentum, but not a synchronized downturn. Growth across major economies continued to weaken unevenly, with manufacturing and trade acting as a drag while services activity and labor markets provided stability. This imbalance shaped both market expectations and policy decisions into year end and helps explain why recession concerns did not dominate pricing despite weaker headline growth indicators.
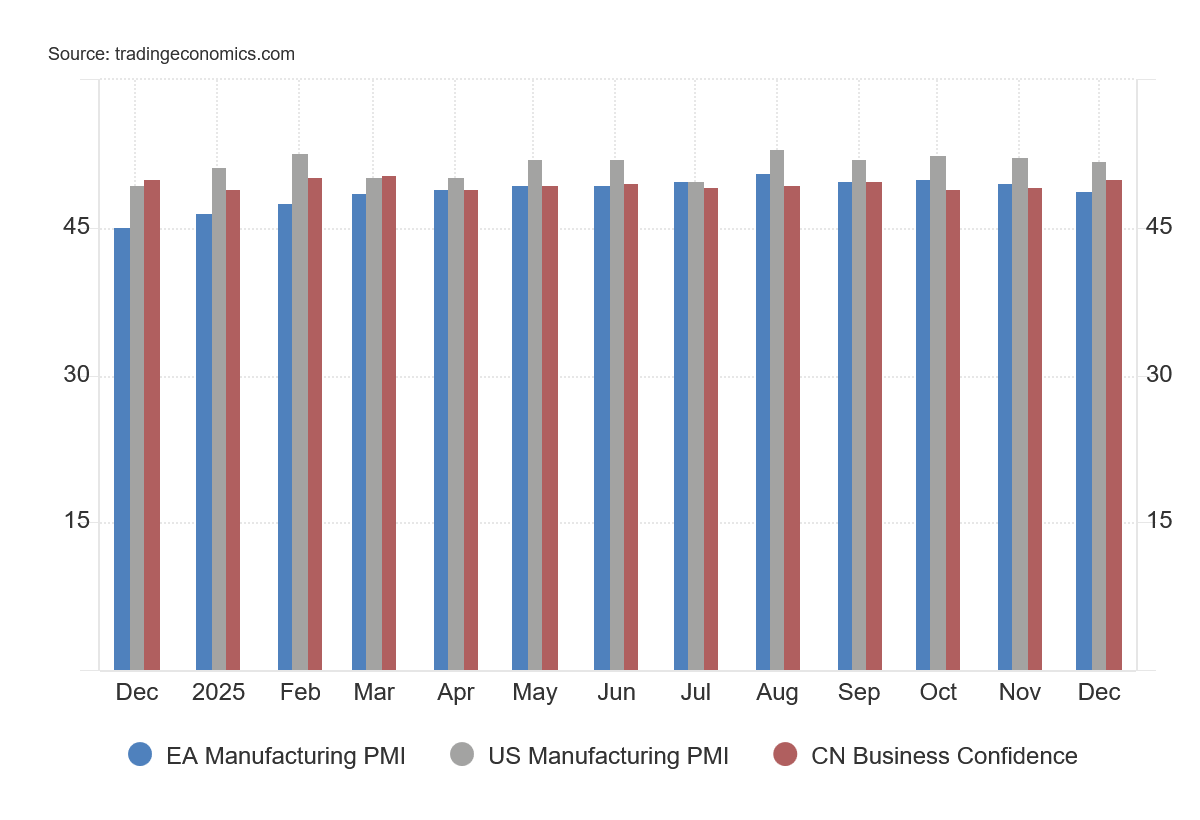
This chart shows manufacturing and business activity indicators for the euro area, the United States, and China. Readings remained below or near the 50 level for much of the period, indicating ongoing weakness in global manufacturing rather than a short-term slowdown.
The most persistent sign of global weakness remained manufacturing. Survey based indicators showed that global factory activity stayed below the 50 expansion threshold through much of 2025, including a reading of 49.6 in November. This pattern was not an isolated data point but part of a longer period of contraction, suggesting that manufacturing weakness was structural rather than temporary. Slower new orders, softer export demand, and inventory drawdowns following earlier restocking cycles continued to weigh on output. Higher borrowing costs and tighter financial conditions remained a constraint on capital intensive manufacturing, particularly in Europe and parts of Asia. For markets, the persistence of sub 50 readings mattered more than month to month fluctuations, reinforcing the view that manufacturing would remain a drag on global growth.
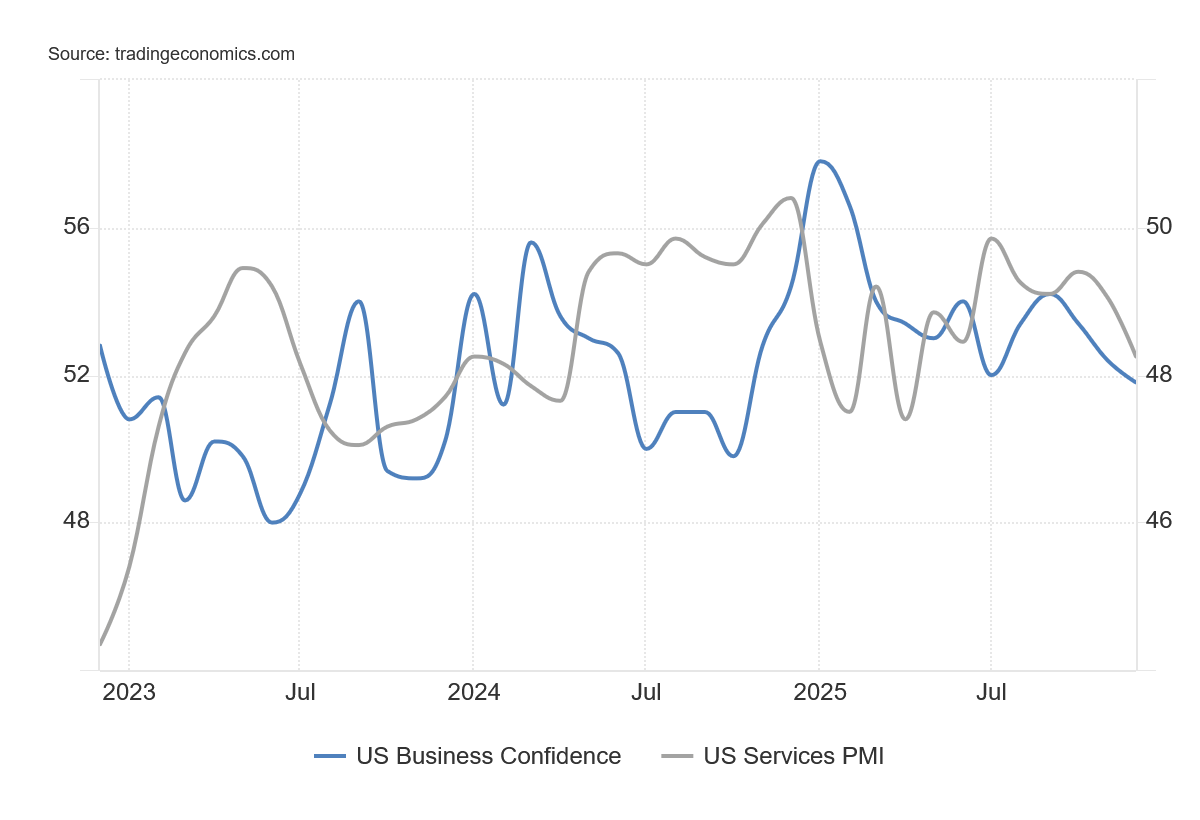
US manufacturing vs services activity, 2024–2025
Manufacturing activity remained weaker than services throughout the period, while services stayed in expansion. This divergence helps explain why overall economic growth slowed without a sharp downturn.
In contrast, services activity showed much greater resilience. In the United States, services indicators remained in expansion, with the ISM Services PMI at 52.7 in November even as manufacturing activity stayed in contraction. This divergence reflected different demand drivers across sectors. Services benefited from steady consumer spending, continued demand for travel, healthcare, and professional services, and less direct exposure to global trade cycles. Because services account for a larger share of output in developed economies, this strength helped prevent a sharper slowdown in overall growth despite weak factory activity. Services demand effectively absorbed some of the pressure coming from higher interest rates and softer trade conditions.
Labor markets played a central role in sustaining this balance. Unemployment rates in both the US and Canada increased modestly through 2025 but remained low by historical standards. In the US, the unemployment rate stood at 3.8% in November, while Canada’s rate was higher at 5.8%. These levels reflected cooling labor demand rather than widespread job losses. Hiring slowed in interest rate sensitive sectors such as construction and real estate, but layoffs remained limited. Wage income continued to support household spending, helping maintain consumer confidence and reinforcing the resilience seen in services activity.
Regional growth differences further contributed to uneven global momentum. The US continued to grow faster than other major economies, supported by stronger domestic demand and a more flexible labor market. In contrast, euro area growth stalled, with GDP flat on a quarter over quarter basis in the third quarter. Europe faced a combination of weak industrial production, softer external demand, and tighter credit conditions, which limited investment and constrained consumption. Although inflation eased, real income growth lagged North America, reducing Europe’s contribution to global demand.
China’s growth remained positive but uneven. Industrial production continued to expand modestly, but property sector weakness and soft household demand weighed on overall momentum. Policy measures helped prevent a sharper slowdown, but China did not act as a strong engine of global growth in December, particularly through trade or commodity demand. This limited upside support for global manufacturing and contributed to continued weakness in export oriented economies.
Taken together, the data pointed to a global economy that was slowing but not collapsing. Manufacturing contraction and weak trade weighed on growth, while services activity and labor market resilience provided a floor. The absence of a clear growth engine meant that global activity lacked acceleration, but the presence of stabilizing forces reduced the risk of an immediate recession. This balance kept markets focused on interest rates, inflation trends, and sector level performance rather than on broad economic contraction during December.
Looking ahead, the key risk for global economic activity is whether prolonged weakness in manufacturing begins to spill into services and labor markets. If employment conditions deteriorate meaningfully, consumer spending could weaken and turn a gradual slowdown into broader economic stress. For now, labor markets remain the main stabilizing force.
Manufacturing indicators suggest continued pressure unless global demand improves or financial conditions ease further. Services activity is likely to remain more stable in the near term but remains sensitive to labor market trends. Regionally, Europe appears most exposed to downside risks, while the US remains relatively better positioned due to stronger domestic demand. China’s policy stance will remain important, but current data points to stabilization rather than strong acceleration.
-
S&P Global: J.P. Morgan Global Manufacturing PMI releases
https://www.pmi.spglobal.com/Public/Home/PressReleaseInstitute for Supply Management: ISM Manufacturing PMI
https://www.ismworld.org/supply-management-news-and-reports/reports/ism-report-on-business/pmi/Institute for Supply Management: ISM Services PMI
https://www.ismworld.org/supply-management-news-and-reports/reports/ism-report-on-business/services/US Bureau of Labor Statistics: Employment Situation Summary
https://www.bls.gov/news.release/empsit.nr0.htmStatistics Canada: Labour Force Survey
https://www150.statcan.gc.ca/n1/daily-quotidienEurostat: GDP and Industrial Production Statistics
https://ec.europa.eu/eurostatNational Bureau of Statistics of China: Monthly and Quarterly Economic Indicators
https://www.stats.gov.cn/english/
Equity Market
Equity markets in December 2025 delivered muted headline performance, but underlying market dynamics showed meaningful shifts in leadership driven by interest rates, sector composition, and valuation sensitivity. Major equity indices finished the month close to flat, yet differences across regions and styles highlighted how markets continued to adjust to higher long term interest rates rather than responding to changes in economic growth expectations alone.
In the United States, large cap equities showed limited movement. The S&P 500 rose 0.48% over the month, ending December at 6,845.50. Performance was supported by stable earnings expectations and resilient corporate balance sheets, even as higher long term yields weighed on valuation multiples. In contrast, the Nasdaq Composite declined 0.15%, reflecting continued pressure on technology and other long duration growth stocks. The relative underperformance of the Nasdaq underscored how sensitive growth oriented equities remained to changes in discount rates, even when broader market conditions were stable.
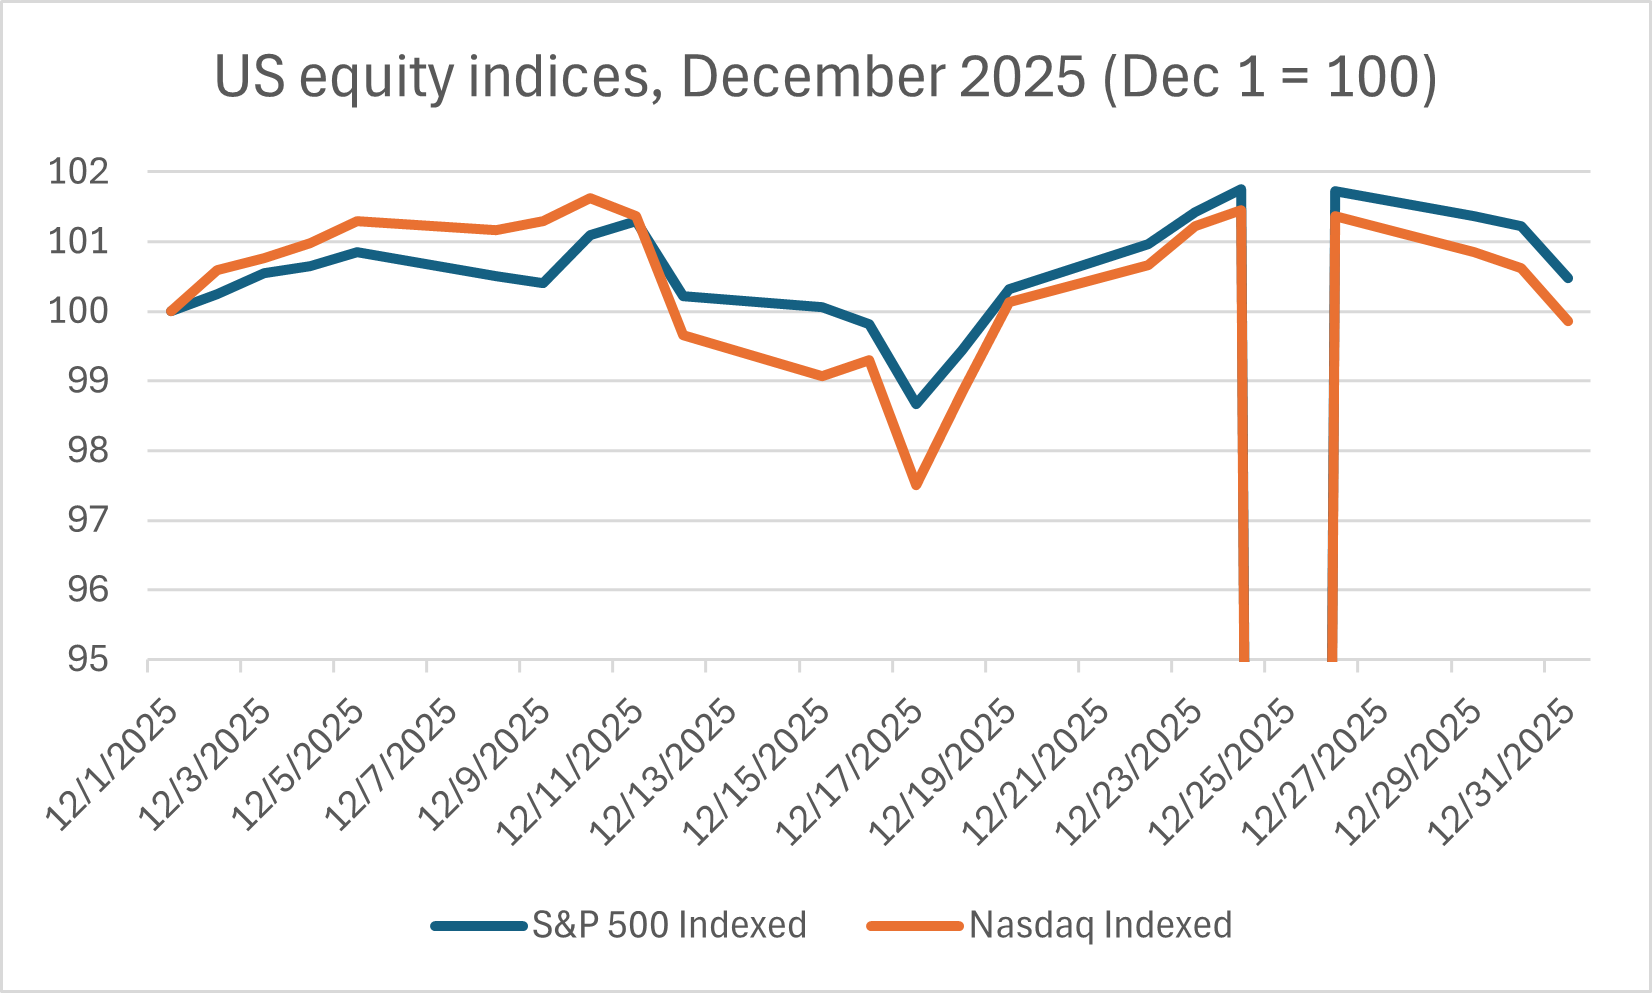
US equity indices, December 2025 (Dec 1 = 100)
This chart compares December performance of the S&P 500 and Nasdaq Composite, indexed to 100 at the start of the month to highlight relative movements rather than index levels.
Sector level performance further reinforced this theme. Rate sensitive growth sectors such as technology and communication services lagged more defensive and cash flow stable sectors. Financials benefited from a modest steepening of the yield curve, as higher long term yields improved net interest margin expectations. Energy equities were mixed, reflecting lower oil prices during the month, while consumer staples and utilities showed relative resilience amid increased uncertainty around rates.
Equity market performance outside the US was more uneven. Canadian equities broadly tracked global trends, with gains in financials and materials partially offset by weakness in energy stocks as crude prices declined. The TSX Composite showed limited overall movement, reflecting the index’s heavier exposure to cyclical and commodity linked sectors compared with US benchmarks.
European equities continued to lag North America. Slower economic growth, weaker industrial activity, and lower earnings momentum weighed on equity performance. Although easing inflation improved real income conditions, tighter credit availability and weaker demand limited upside for European stocks. Valuations remained lower than in the US, but this discount reflected structural growth concerns rather than near term opportunity.
Asian equity markets delivered mixed results. Japanese equities remained supported by corporate governance reforms and improving return on equity trends, but rising domestic bond yields introduced new valuation pressure. Chinese equities continued to struggle, reflecting weak investor confidence, property sector stress, and limited earnings visibility despite policy support measures. As a result, Asia did not provide a strong positive contribution to global equity performance in December.
Across regions, equity volatility remained relatively contained. The VIX index traded mostly in the mid teens through December, indicating that markets did not price a sharp increase in near term risk. This low volatility environment suggested that investors viewed higher interest rates as a valuation headwind rather than a trigger for broad risk reduction.
Overall, December equity performance reflected adjustment rather than disruption. Markets continued to reprice long duration assets in response to higher long term yields, while earnings expectations and balance sheet strength provided support. The result was narrow index level movement alongside clearer sector and style differentiation.
Fixed Income and Credit
Fixed income markets in December 2025 were shaped by a combination of easing policy at the short end, upward pressure on long term yields, and continued strength in credit markets. While central banks signaled greater confidence that inflation had moderated, bond markets did not fully translate this into lower long term borrowing costs. As a result, fixed income performance varied meaningfully across maturities and credit quality.
In the United States, Treasury yields moved in opposite directions across the curve. The 2 year Treasury yield declined from 3.54% at the start of December to 3.47% by month end, reflecting expectations that the Federal Reserve would continue easing policy after its December rate cut. In contrast, the 10 year Treasury yield increased from 4.09% to 4.18% over the same period. This divergence led to a modest steepening of the yield curve, driven more by rising long term yields than by falling short term rates.
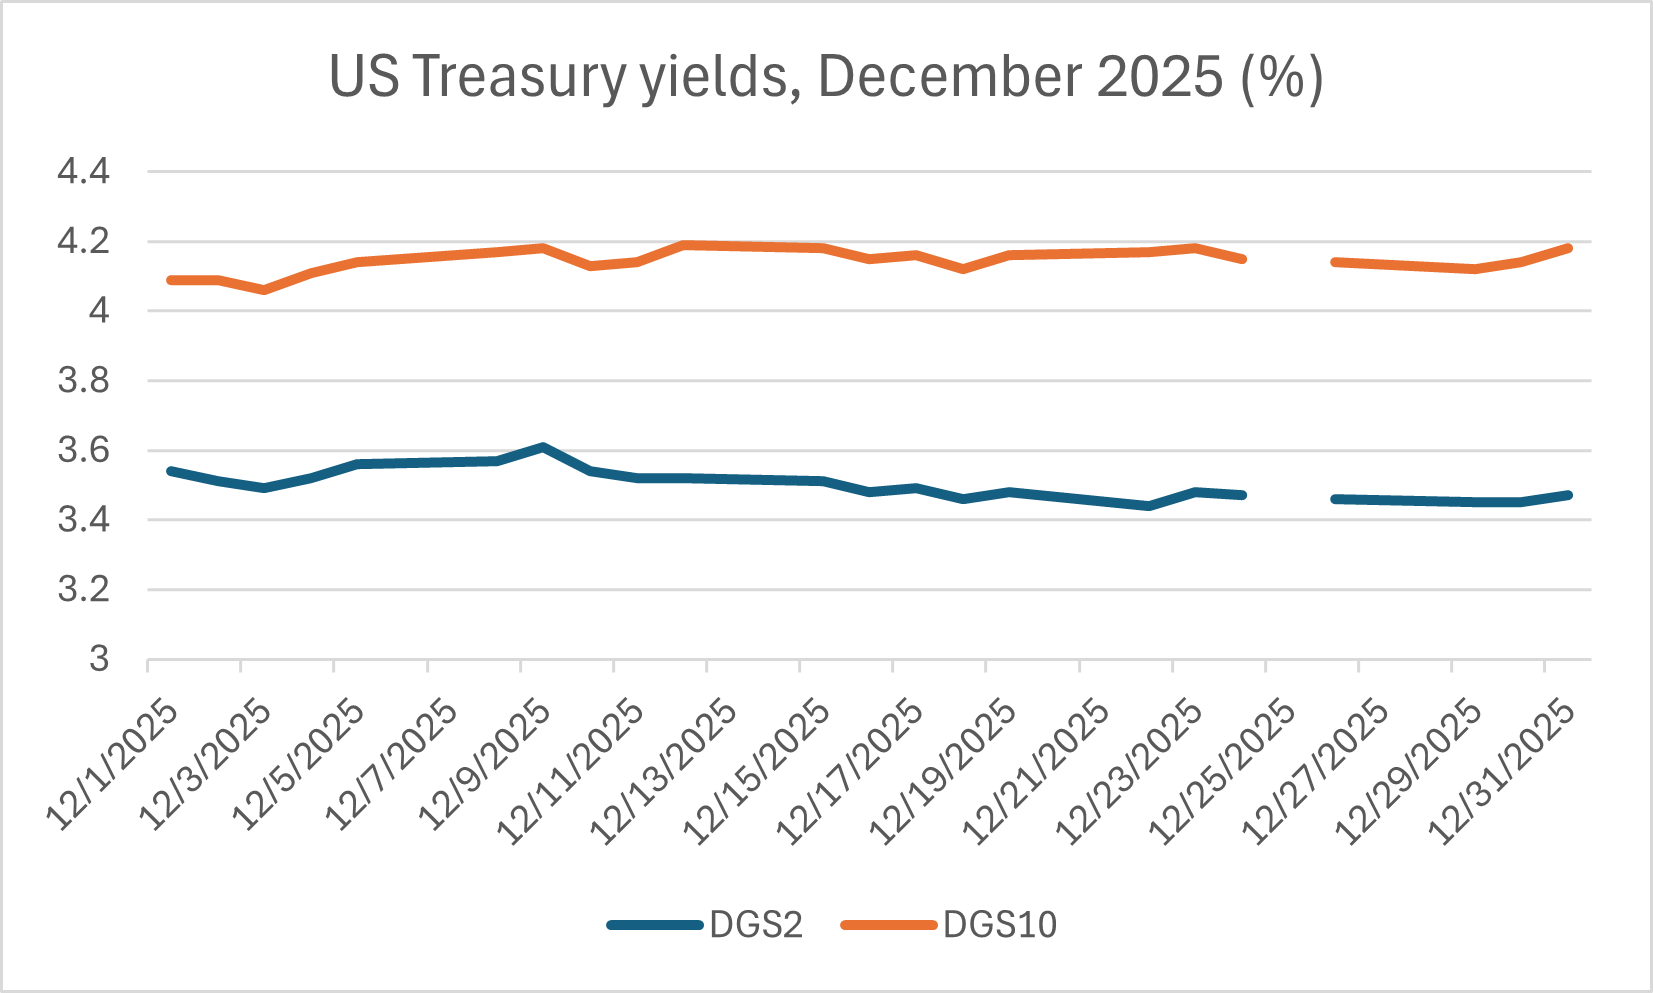
US Treasury yields, December 2025 (%)
Short term yields declined during the month while long term yields moved higher, resulting in a modest steepening of the yield curve.
This pattern mattered for fixed income returns. Short duration bonds benefited from lower front end yields and limited price volatility, while long duration bonds faced headwinds as higher yields reduced bond prices. The move suggested that investors were comfortable with near term inflation progress but remained cautious about longer term growth, government borrowing, and supply of Treasuries. As a result, duration risk remained a key driver of performance rather than credit risk.
Credit markets told a different story. Despite higher long term Treasury yields, credit spreads continued to tighten through December. US investment grade corporate bond spreads narrowed from 0.82% at the start of the month to 0.79% by month end. High yield spreads tightened more meaningfully, declining from 2.94% to 2.81%. These moves indicated that investors required less additional compensation to hold corporate bonds relative to government bonds, pointing to confidence in corporate balance sheets and default risk remaining contained.
The tightening in spreads helped offset the impact of higher Treasury yields on total returns for corporate bonds. Investment grade credit delivered relatively stable performance, supported by carry and declining spreads, while high yield bonds benefited from both yield income and improving risk sentiment. The strength of credit markets suggested that financial conditions remained supportive even as risk free rates stayed elevated.
Outside the US, fixed income trends broadly followed the same pattern. Canadian government bond yields remained sensitive to US Treasury movements, with domestic yields influenced more by global rate dynamics than by local inflation surprises. Credit conditions in Canada remained stable, supported by a resilient banking system and relatively low default rates. In Europe, sovereign yields moved higher alongside global bond markets, while credit spreads remained contained despite slower economic growth. The stability of European credit spreads suggested that markets viewed weak growth as manageable rather than as a trigger for widespread credit stress.
Overall, December highlighted a clear separation between interest rate risk and credit risk. Bond markets continued to price uncertainty around long term rates, while credit investors showed confidence that corporate borrowers could service debt under current conditions. This divergence reinforced the idea that fixed income performance was increasingly about positioning along the yield curve and across credit quality rather than a simple risk on or risk off trade.
Looking ahead, fixed income markets are likely to remain sensitive to the path of long term yields. Even if policy rates continue to fall gradually, higher government borrowing and sustained bond supply could keep upward pressure on longer maturities. In that environment, shorter duration bonds and high quality credit may remain more attractive than long duration government bonds. Credit spreads may have limited room to tighten further, but as long as labor markets and earnings remain stable, a sharp widening in spreads appears unlikely in the near term. This suggests a continued preference for carry driven strategies over duration heavy positioning.
-
Federal Reserve Economic Data (FRED): S&P 500 Index Level
https://fred.stlouisfed.org/series/SP500Federal Reserve Economic Data (FRED): Nasdaq Composite Index Level
https://fred.stlouisfed.org/series/NASDAQCOMFederal Reserve Economic Data (FRED): Russell 1000 Growth Index
https://fred.stlouisfed.org/series/RLGFederal Reserve Economic Data (FRED): Russell 1000 Value Index
https://fred.stlouisfed.org/series/RLVFederal Reserve Economic Data (FRED): Equity Sector ETF Prices (XLK, XLF, XLE, XLP, XLU)
https://fred.stlouisfed.orgFederal Reserve Economic Data (FRED): CBOE Volatility Index (VIX)
https://fred.stlouisfed.org/series/VIXCLS
Commodities & Alternatives
Commodities markets in December 2025 reflected a combination of softer global demand signals, easing inflation pressure, and uncertainty around long term interest rates rather than acute supply disruptions. Across energy, industrial metals, and precious metals, price action remained generally range bound, with movements driven more by macro expectations and policy outlooks than by physical shortages. Alternative assets continued to attract interest primarily as diversification tools in an environment of higher rates and slower growth, rather than as vehicles for aggressive return seeking.
Energy prices weakened modestly through the month. West Texas Intermediate crude oil prices declined from approximately $59.5 per barrel at the start of December to around $57.9 per barrel by the final trading days of the month, a decline of roughly 2.5% to 3% month over month. Brent crude followed a similar path, remaining below $62 per barrel by year end. The price softness aligned with weaker global manufacturing indicators and limited evidence of demand acceleration, particularly from China. Manufacturing PMIs across major economies remained below expansion levels, and global trade volumes showed little improvement, reducing expectations for near term oil consumption growth.
On the supply side, production conditions remained relatively stable. OPEC+ output discipline limited downside risk but did not provide enough tightening to offset demand concerns. US crude inventories remained within historical ranges through December, and there were no sustained geopolitical disruptions large enough to materially constrain supply. As a result, oil prices contributed modestly to disinflation heading into year end rather than acting as an inflationary shock.
Natural gas prices remained volatile but broadly subdued. US Henry Hub natural gas prices stayed below $3.00 per million British thermal units for most of December, reflecting strong domestic supply and relatively mild winter demand expectations. European natural gas prices were also well below the peaks observed during the energy crisis earlier in the decade, supported by high storage levels and diversified supply sources. Lower gas prices reduced cost pressure for households and industry, further easing near term inflation risks in energy sensitive regions.
Industrial metals presented a mixed picture. Copper prices traded in a relatively narrow range through December, generally around $3.80 to $3.90 per pound. The lack of a strong directional move reflected opposing forces. Weaker global manufacturing activity and slower construction demand weighed on near term consumption, while longer term themes such as electrification, grid investment, and constrained new supply provided underlying support. The stability in copper prices suggested that markets were pricing slower growth but not a sharp global contraction.
Iron ore prices remained under pressure, reflecting continued weakness in China’s property sector. Prices stayed below $110 per metric ton through much of December, well below the highs seen during earlier expansion phases. Despite policy easing measures, construction activity in China did not rebound strongly enough to lift demand for steel inputs. This continued to weigh on bulk commodity exporters and limited upside for industrial materials prices more broadly.
Agricultural commodities showed limited net movement during December. Grain prices remained sensitive to weather conditions and global supply balances, but there were no major shocks large enough to drive sustained price changes over the month. Food commodity price stability further reinforced the easing inflation narrative toward year end.
Precious metals remained supported despite higher long term yields. Gold prices traded around $2,000 to $2,050 per ounce through December, ending the month near the upper end of that range. Gold benefited from uncertainty around interest rates, elevated government borrowing, and ongoing geopolitical risk, even as inflation pressures eased. While rising long term yields typically reduce the appeal of non yielding assets, continued volatility in rates and concerns around fiscal sustainability supported demand for gold as a hedge.
Silver prices broadly tracked gold but with greater volatility, reflecting silver’s dual role as both a precious metal and an industrial input. Industrial weakness limited upside, while safe haven demand provided partial support, resulting in relatively flat month over month performance.
Beyond traditional commodities, alternative assets continued to reflect the impact of higher long term interest rates. Real assets such as infrastructure and real estate faced valuation pressure due to higher discount rates and financing costs. Commercial real estate remained under stress in certain segments, particularly office, while infrastructure assets with regulated or inflation linked cash flows showed more resilience. Investor interest focused on asset quality, duration of cash flows, and balance sheet strength rather than broad sector exposure.
Private markets activity remained selective. Deal volumes did not accelerate meaningfully in December, as higher borrowing costs and cautious growth assumptions continued to influence transaction decisions. Private equity and private credit strategies emphasized downside protection, covenant structure, and yield rather than leverage driven returns. In private credit, higher base rates supported income generation, but credit underwriting standards remained tight given the late cycle growth environment.
Hedge fund strategies experienced more favorable conditions than directional commodity investments. Relative value and macro strategies benefited from dispersion across interest rates, currencies, and asset classes, while trend following strategies remained constrained by range bound commodity prices. The performance divergence within alternatives underscored the importance of strategy selection rather than asset class exposure alone.
Overall, commodities and alternatives in December reflected a macro environment defined by slower growth, easing inflation pressure, and elevated interest rate uncertainty. Energy and industrial metals signaled caution around global demand, while precious metals and select alternative strategies benefited from hedging and diversification demand. Looking ahead, commodity prices are likely to remain sensitive to changes in global growth expectations, China’s policy response, and geopolitical developments, while alternative assets will continue to be shaped primarily by the level and volatility of long term interest rates rather than short term market sentiment.
-
Federal Reserve Economic Data (FRED): Cushing, OK WTI Spot Price
https://fred.stlouisfed.org/series/DCOILWTICOFederal Reserve Economic Data (FRED): Henry Hub Natural Gas Spot Price
https://fred.stlouisfed.org/series/DHHNGSPFederal Reserve Economic Data (FRED): Global Copper Price
https://fred.stlouisfed.org/series/PCOPPUSDMLondon Bullion Market Association: Gold Price Data
https://www.lbma.org.uk/prices-and-data/precious-metal-pricesWorld Steel Association and Iron Ore Market Indicators
https://worldsteel.org
Key Themes of the Month
Theme 1: The Repricing of Duration Risk
December 2025 reinforced a critical shift in fixed income markets: central bank easing no longer guaranteed lower long term interest rates. Despite policy signals turning more accommodative, long dated government bond yields moved higher across major markets, forcing investors to reassess duration risk across asset classes.
In the United States, this divergence was most visible. The Federal Reserve cut its policy rate in December, and short term rates responded accordingly. The 2 year Treasury yield declined from roughly 3.54% at the start of the month to around 3.47% by month end, reflecting expectations of further easing in 2026. However, the 10 year Treasury yield moved in the opposite direction, rising from approximately 4.09% to about 4.18% over the same period. As a result, the yield curve steepened modestly, not because short rates collapsed, but because long term yields increased.
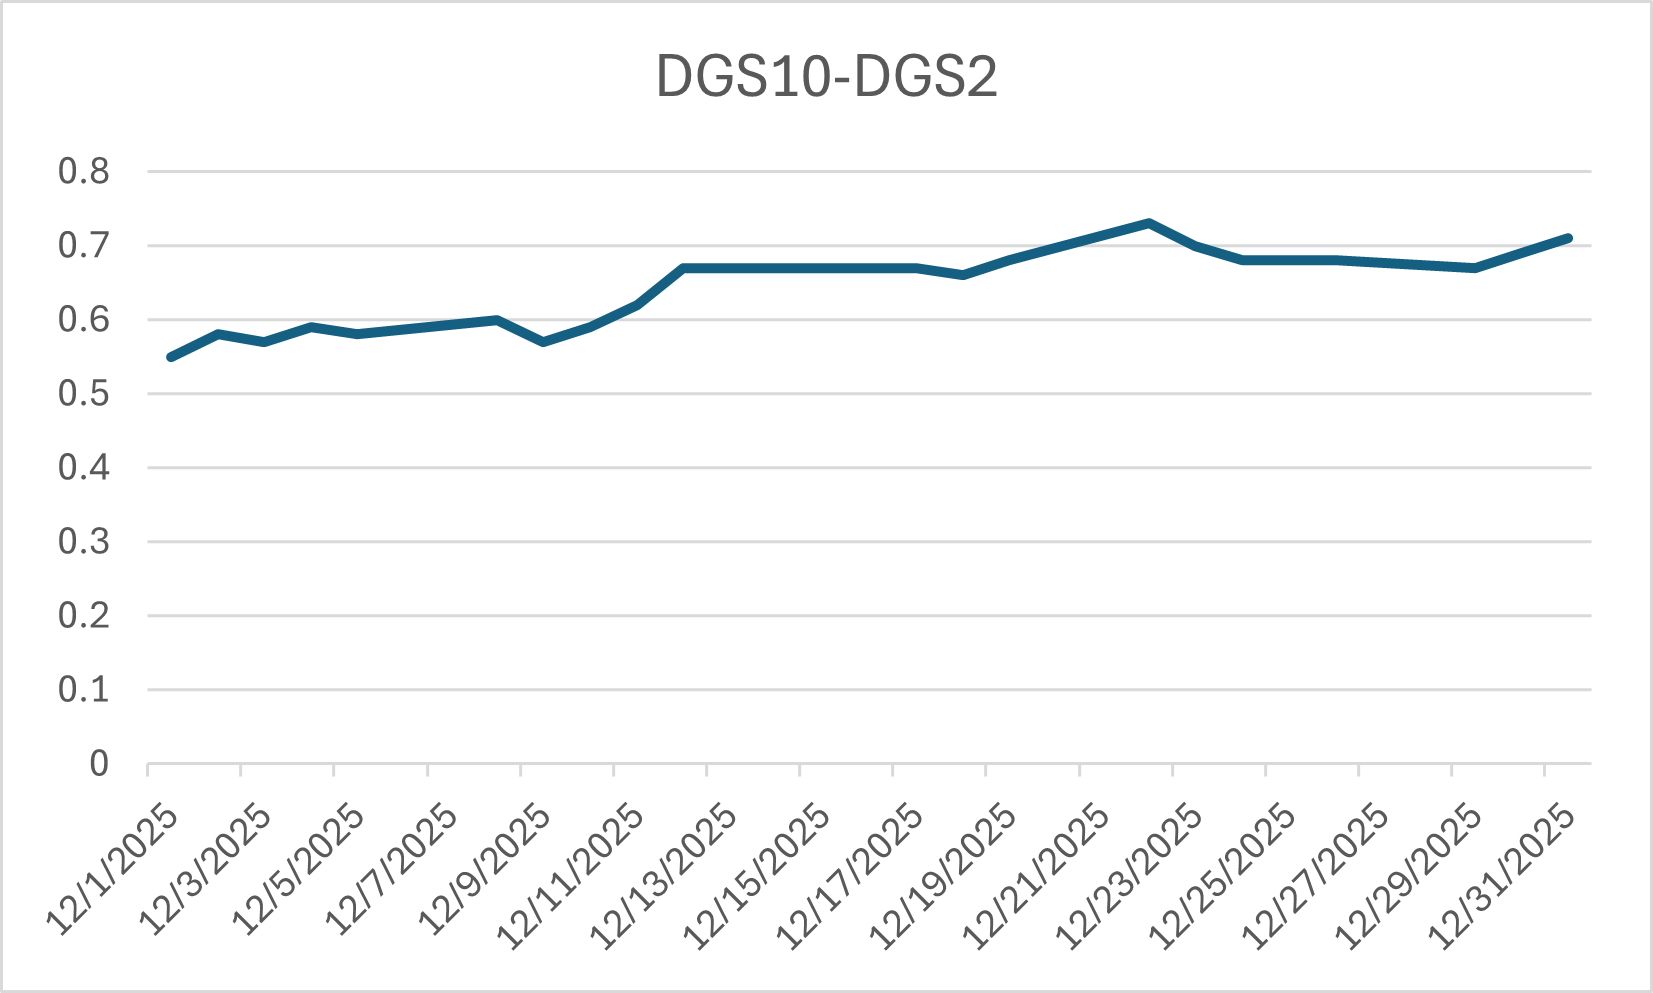
US Treasury yield curve slope (10Y minus 2Y)
The yield curve steepened into year end as long term yields rose relative to short term rates, reflecting a repricing of duration risk.
This pattern signaled that bond investors were not focused solely on near term inflation progress or central bank policy decisions. Instead, longer dated yields appeared to reflect concerns around sustained government borrowing, increased bond supply, and uncertainty about the long run neutral rate. US Treasury issuance remained elevated, and expectations of continued fiscal deficits added upward pressure on term premiums. Even as inflation moved closer to target, investors demanded higher compensation for holding long duration assets.
Similar dynamics appeared outside the US. In Europe, sovereign yields also drifted higher during December, despite easing inflation and weak growth. German 10 year bund yields rose modestly over the month, moving away from the lows seen earlier in the year. In Japan, long term yields remained elevated following the Bank of Japan’s gradual shift away from yield curve control. Japanese 10 year government bond yields stayed near multi year highs, reinforcing the global nature of upward pressure at the long end of the curve.
The repricing of duration had clear cross asset implications. Long duration government bonds underperformed shorter maturity bonds, as higher yields translated directly into price declines. Equity markets also reflected this pressure, particularly in growth oriented segments where valuations depend more heavily on long term discount rates. Real assets and infrastructure investments, which are often valued based on long dated cash flows, faced similar headwinds.
Importantly, the rise in long term yields did not coincide with rising inflation expectations. Market based inflation measures remained relatively stable, suggesting that the move was driven more by real rates and term premiums than by renewed inflation fears. This distinction mattered for asset allocation. Investors were not repositioning for overheating growth, but rather adjusting to a world where long term capital is priced more expensively.
Looking ahead, this dynamic suggests that duration risk may remain a central driver of market performance even if policy rates continue to decline. If government borrowing remains high and bond supply stays elevated, long term yields may prove sticky. In that environment, assets with lower duration exposure and stronger near term cash flows are likely to remain more resilient, while long duration assets may continue to face valuation pressure despite easing monetary policy.
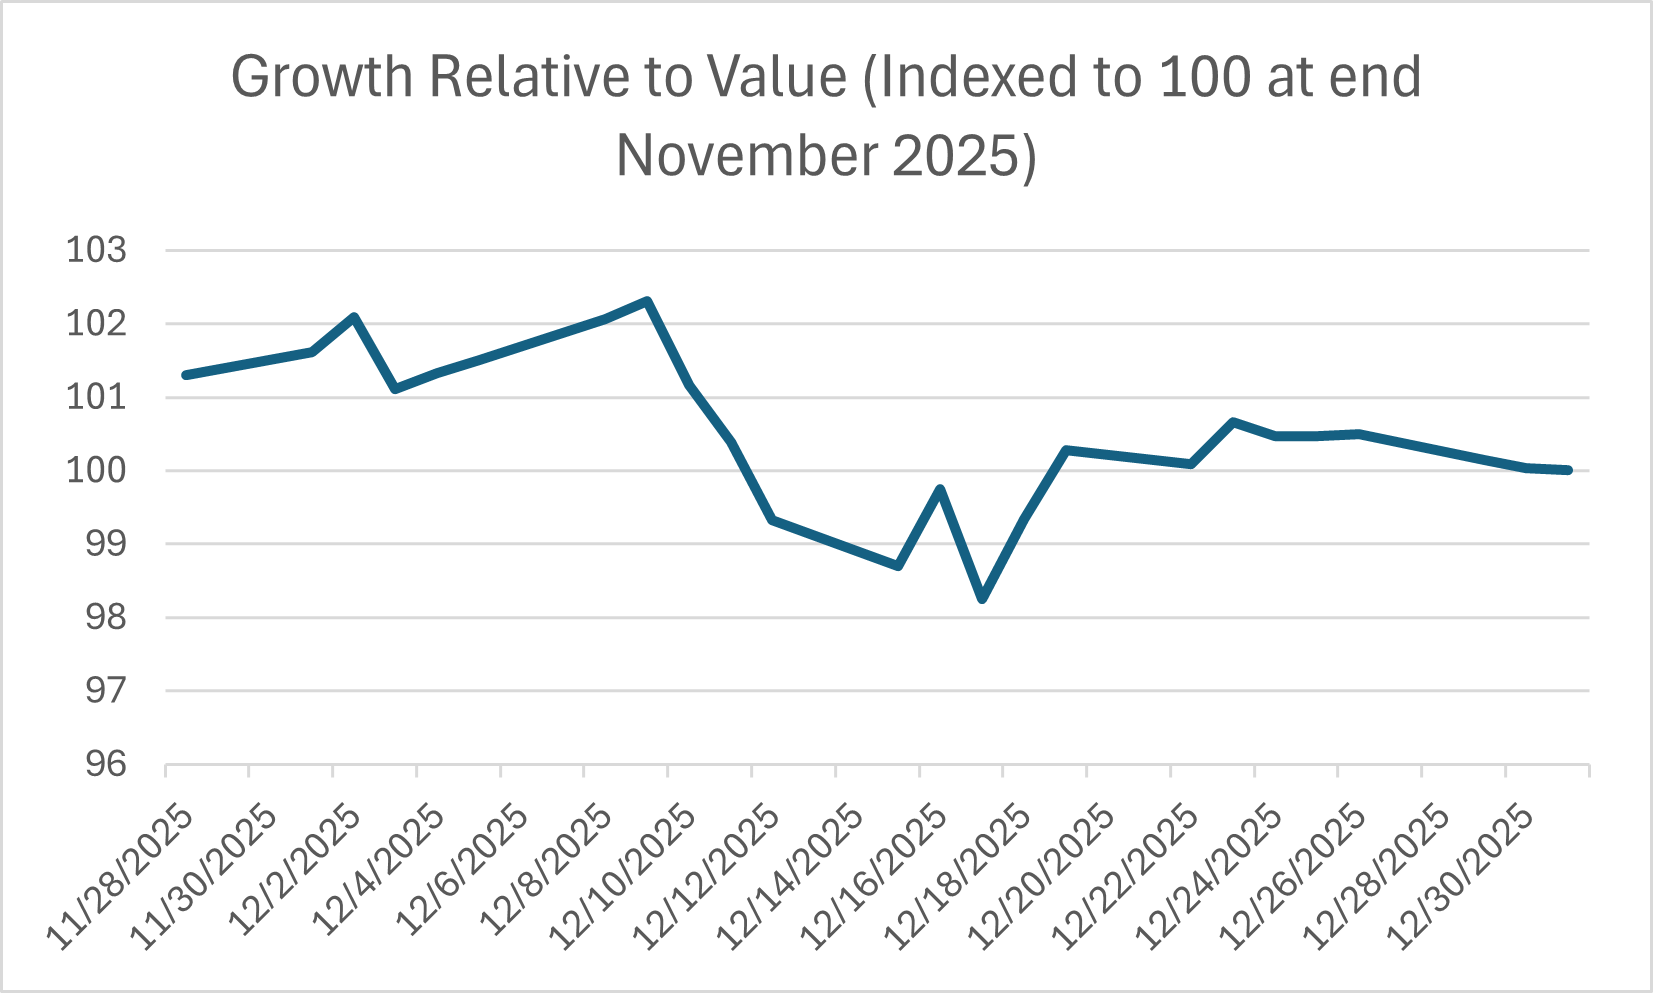
Equity Markets Repriced Duration Through Style and Sector Rotation
Equity markets in December 2025 reflected a continued repricing of duration risk through clear style and sector rotation rather than broad de risking. Growth equities underperformed value equities across major developed markets, with the gap most visible in the United States. Large cap growth indices posted flat to modestly negative returns during the month, while value indices delivered low single digit gains. This divergence occurred despite limited changes to aggregate earnings expectations, indicating that valuation sensitivity to long term discount rates was the dominant driver rather than near term profit revisions.
Within US equities, sector level performance reinforced this duration driven interpretation. Technology and communication services lagged the broader market in December, with several growth heavy subsectors declining by low single digit percentages. By contrast, financials, energy, and selected defensive sectors such as utilities and consumer staples held up more effectively, many posting positive returns in the 1% to 4% range. This rotation aligned closely with differences in cash flow timing. Sectors with nearer term and more stable cash generation experienced less valuation pressure as long term yields remained elevated through most of the month.
The Nasdaq Composite underperformed relative to broader indices for the same reason. Its higher concentration of long duration assets made it more sensitive to changes in long term discount rates even as policy rate expectations shifted modestly lower. December saw limited evidence of widespread earnings downgrades within large cap technology, yet valuation multiples compressed as investors applied higher required returns to future cash flows. This dynamic explains why performance divergence occurred without a corresponding increase in recession sensitive positioning.
Financials benefited from the same repricing mechanism. Higher long term yields supported net interest income expectations and reduced concerns around margin compression, while balance sheets remained resilient. Cash flow stable sectors also attracted flows as investors rotated toward assets with lower duration exposure. Importantly, this behavior did not coincide with material widening in equity risk premia or sharp drawdowns in cyclical value segments, reinforcing that the move reflected discount rate mechanics rather than deteriorating growth expectations.
Structurally, this episode highlighted how equity markets increasingly transmit duration repricing through relative performance instead of broad market selloffs. Month specific moves in December amplified an existing trend that has favored balance sheet strength and cash flow visibility over distant growth optionality. As long term yields remain a central input into equity valuation frameworks, relative sector and style performance is likely to continue acting as a pressure valve for duration risk rather than triggering uniform equity market declines.
International Equity Markets Absorbed Duration Repricing Unevenly Across Regions
International equity markets in December 2025 displayed a fragmented response to the repricing of duration risk, with regional outcomes shaped by differences in sector composition, valuation starting points, and sensitivity to long term yields. While the United States saw duration pressures transmitted primarily through style rotation, other major regions experienced more muted or uneven effects, reflecting lower exposure to long duration growth assets and different macro backdrops.
European equities were comparatively resilient during the month. Broad European indices delivered modest positive returns in December, supported by a heavier weighting toward financials, industrials, and energy. These sectors tend to generate nearer term cash flows and exhibit lower valuation sensitivity to changes in long term discount rates. Despite elevated global yields, valuation compression in Europe was limited, and earnings expectations remained broadly stable. This suggests that structural sector composition, rather than short term optimism, insulated European equities from the duration driven headwinds that weighed on US growth stocks.
Japanese equities also held up relatively well, continuing a trend seen through much of 2025. The Japanese market’s lower aggregate valuation multiples and reduced reliance on distant growth assumptions limited the impact of higher global long term yields. Financials and export oriented industrials supported index performance, while technology exposure remained less concentrated than in US benchmarks. Currency dynamics also played a role, but the equity response itself pointed to lower embedded duration risk rather than improved growth expectations.
In contrast, parts of Asia outside Japan experienced more pronounced dispersion. Markets with higher exposure to technology hardware and platform companies faced valuation pressure similar to that seen in the Nasdaq, though to a lesser degree. At the same time, domestic oriented sectors and dividend paying stocks in several Asian markets outperformed, reinforcing the pattern of investors favoring shorter duration cash flows. Importantly, this divergence occurred without a synchronized deterioration in regional economic data, indicating that equity pricing adjustments were driven more by discount rate sensitivity than by fears of slowing activity.
Structurally, December highlighted that duration repricing is not a uniform global equity event. Month specific moves reflected how regional equity indices differ in cash flow timing and valuation structure. As long term yields remain a central variable for global asset pricing, relative regional equity performance is likely to continue reflecting differences in embedded duration exposure rather than signaling a broad based shift in global growth expectations.
Theme 2: Credit Markets as the Shock Absorber
Credit Spreads Remained Contained Despite Duration Volatility
Credit markets in December 2025 continued to function as a stabilizing channel for financial conditions even as long term yields remained elevated. US investment grade and high yield credit spreads moved only modestly during the month, ending December close to late November levels. This stability stood in contrast to ongoing volatility in duration sensitive assets and reinforced the view that credit investors did not interpret higher long term rates as a signal of deteriorating corporate fundamentals.
The containment of spreads was most visible in investment grade credit. Option adjusted spreads for broad US investment grade indices fluctuated within a narrow range during December, with month end levels showing little net change. This occurred despite sustained pressure on long dated Treasuries earlier in the month, indicating that spread compensation for credit risk did not rise alongside term premia. The primary driver was stable earnings expectations and strong balance sheet positioning among large issuers, which reduced the need for investors to demand additional risk compensation.
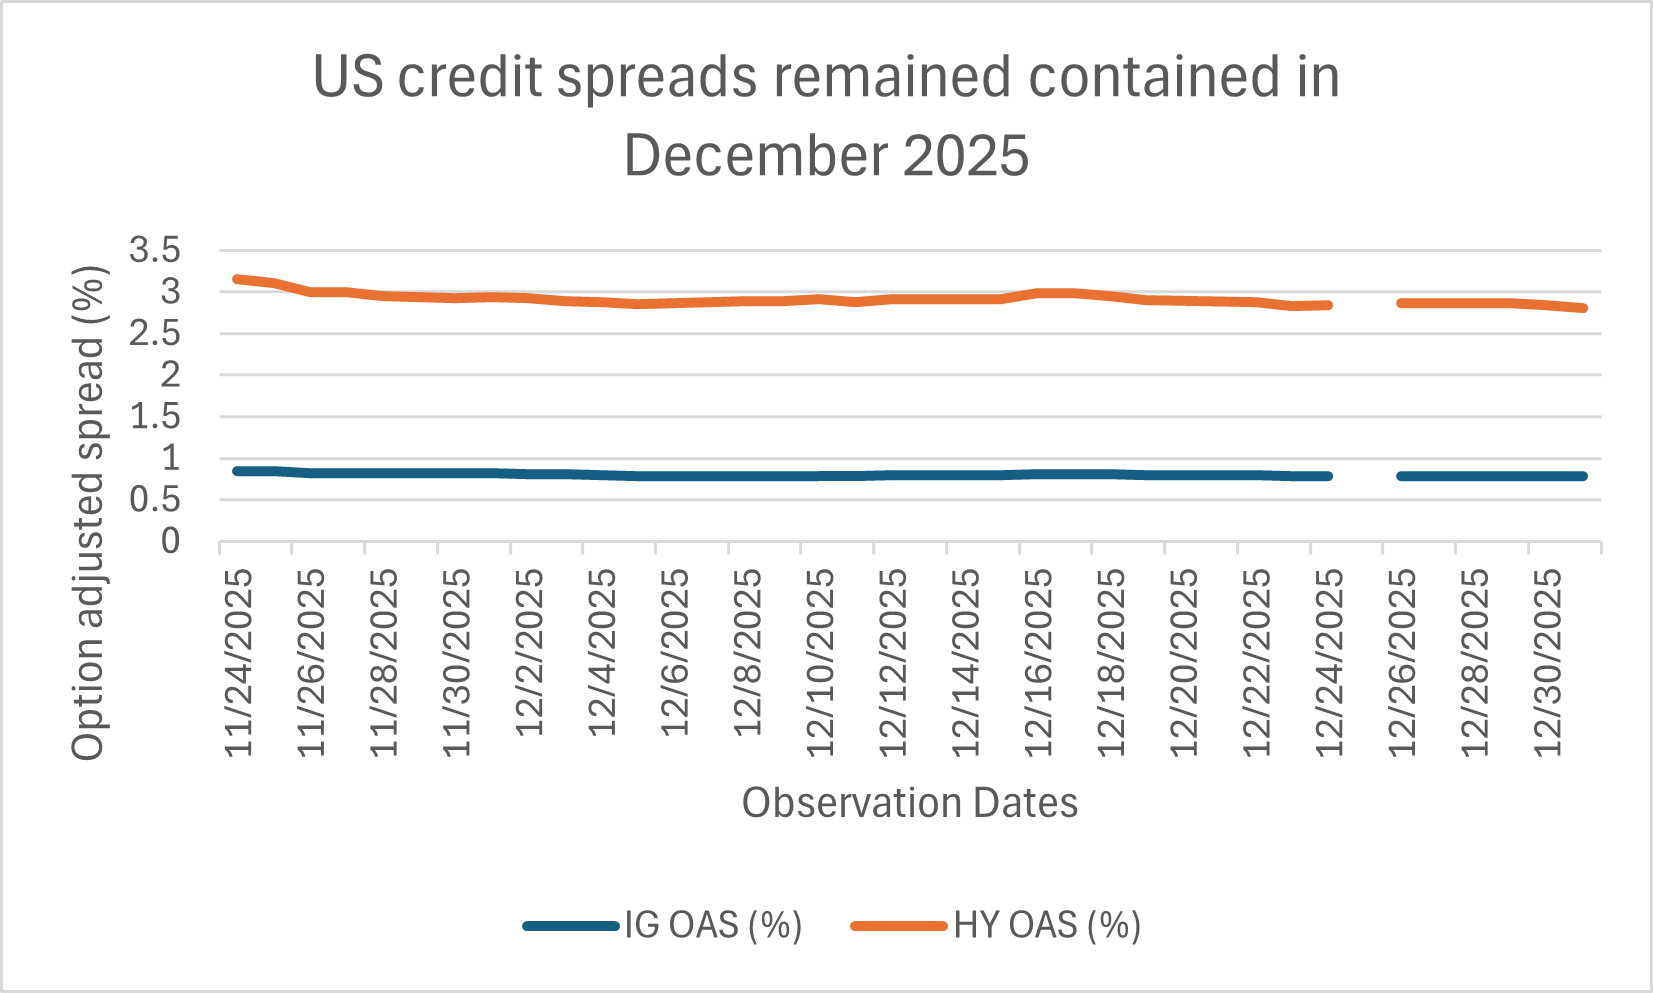
US investment grade and high yield credit spreads remained stable through December 2025 despite elevated long term rate volatility.
High yield markets showed slightly more sensitivity but remained orderly. High yield spreads widened briefly during periods of rate volatility before retracing those moves later in the month. The absence of sustained widening suggested that investors differentiated between duration driven valuation effects and genuine credit deterioration. Importantly, dispersion within high yield increased, with weaker rated and highly levered issuers underperforming while higher quality segments remained relatively stable. This pattern points to selective repricing rather than broad based risk aversion.
From a causal perspective, the key factor was that higher long term yields did not coincide with negative earnings revisions or a tightening in near term liquidity conditions. Credit investors focused on cash flow coverage and refinancing timelines rather than mark to market duration losses. As a result, credit spreads acted as a buffer, absorbing rate volatility without transmitting it directly into higher borrowing costs for most issuers.
Structurally, December reinforced a trend seen throughout 2025 in which credit markets play a shock absorbing role when macro volatility is driven by rates rather than growth. Month specific stability in spreads reflected confidence in issuer fundamentals and reduced refinancing risk in the near term. As long as earnings remain resilient and maturity walls stay manageable, credit pricing is likely to continue responding through issuer level differentiation rather than through indiscriminate spread widening.
Primary Credit Issuance Absorbed Rate Risk Without a Funding Freeze
Primary credit markets remained open and functional through December 2025 despite elevated long term yields and continued repricing of duration risk. US corporate bond issuance slowed modestly from earlier 2025 peaks but did not experience a meaningful disruption. Investment grade issuers continued to access markets at scale, while high yield issuance remained selective rather than frozen. This behavior signaled that higher rates altered issuance economics but did not undermine market access.
Investment grade issuance accounted for the majority of December supply. Large financial and non financial corporates brought deals to market with manageable concessions relative to secondary levels, indicating sustained investor demand. While absolute coupons remained elevated due to higher base rates, order books were generally well covered, allowing issuers to size transactions effectively. The ability to clear primary markets under these conditions reflected confidence in issuer credit quality rather than a willingness to extend duration indiscriminately.
High yield issuance was more constrained but remained active. Issuers with near term refinancing needs or stronger balance sheets were able to place debt, while lower quality borrowers largely stayed sidelined. This compositional shift mattered more than headline issuance totals. Rather than signaling stress, reduced high yield volumes reflected issuer discipline in response to higher all in funding costs. Importantly, the absence of forced issuance suggested that liquidity pressures were not acute.
The key mechanism underpinning this outcome was maturity management. Many corporates entered December with extended debt profiles following heavy issuance in prior years. With limited near term refinancing requirements, issuers could choose when to access markets rather than being compelled to issue into unfavorable conditions. As a result, duration volatility translated into issuance timing decisions rather than into higher credit risk premia.
Structurally, December reinforced the role of primary markets as an adjustment margin rather than a point of failure. Month specific moderation in issuance volumes reflected rate sensitivity and cost awareness, not a breakdown in investor appetite. As long as balance sheets remain resilient and refinancing walls stay pushed out, primary credit markets are likely to continue absorbing duration risk through selective access and pricing discipline rather than through outright funding stress.
Defaults and Downgrades Stayed Idiosyncratic Rather Than Systemic
Credit stress indicators in December 2025 remained contained, with defaults and rating actions reflecting issuer specific weakness rather than a broad deterioration in corporate credit quality. US speculative grade default rates were broadly stable through late November and December data releases, with no evidence of an acceleration tied to higher long term yields. This stability reinforced the message from spreads and issuance that credit markets were absorbing macro volatility without transmitting it into widespread credit impairment.
Rating agency activity during the month showed continued differentiation rather than systemic pressure. Downgrades were concentrated in sectors facing structural challenges or company specific leverage issues, while upgrades remained present in segments benefiting from strong cash flow generation and improved balance sheets. Net rating actions stayed close to late 2025 averages, indicating that higher funding costs alone were insufficient to trigger broad reassessments of creditworthiness.
The absence of a default uptick was closely linked to refinancing dynamics. Many speculative grade issuers entered December with manageable near term maturities, reducing the risk that higher all in yields would force distressed refinancing. Where stress did emerge, it was largely confined to issuers with high leverage, weak interest coverage, or business models sensitive to idiosyncratic demand shocks. This pattern underscored that credit outcomes were driven by balance sheet structure rather than by macro duration repricing.
From a market perspective, this idiosyncratic behavior mattered. Investors were able to price credit risk through security selection and sector allocation instead of demanding higher compensation across the entire asset class. This helped prevent a negative feedback loop in which rising defaults feed back into wider spreads and tighter financial conditions. December’s data suggested that such a loop did not materialize.
Structurally, the month reinforced a broader trend in which credit stress emerges unevenly during periods of rate driven volatility. Short term stability reflected prior years of balance sheet repair and extended maturity profiles. As long as refinancing needs remain staggered and earnings do not weaken materially, defaults and downgrades are likely to continue acting as issuer level signals rather than as triggers for systemic repricing.
Theme 3: Global Growth and Capital Allocation
US Growth Resilience Continued to Anchor Global Capital Flows
Economic data through late November and December 2025 continued to position the United States as the primary anchor of global growth momentum. Incoming indicators pointed to decelerating but still resilient activity, with consumer spending and labor market conditions remaining firmer than in other major developed economies. This relative strength mattered less for near term growth expectations and more for how global capital continued to allocate toward US assets during the month.
Household demand remained a key differentiator. Real personal consumption expenditures continued to expand through November, supported by positive real income growth and stable employment conditions. While the pace of consumption slowed from earlier 2025 highs, there was limited evidence of a sharp retrenchment. Labor market indicators released in December showed job gains moderating but remaining positive, reinforcing confidence in near term cash flow generation across the corporate sector.
From a market perspective, this growth resilience translated into sustained capital inflows rather than risk seeking behavior. US equity and credit markets continued to attract global investment not because growth was accelerating, but because it remained predictable relative to peers. This distinction was important. Capital allocation favored earnings visibility and policy credibility rather than high beta exposure. As a result, US assets absorbed global flows even as valuation sensitivity to long term rates increased elsewhere.
The causal link between growth data and capital flows was reinforced by relative policy positioning. While other regions faced trade offs between supporting activity and maintaining financial stability, US monetary and fiscal frameworks remained perceived as more predictable. This reduced uncertainty premia and supported demand for dollar denominated assets, particularly in credit markets where earnings resilience directly underpinned spread stability.
Structurally, December reinforced the idea that global growth fragmentation does not require outright US outperformance. Month specific data showed that being less weak than peers was sufficient to anchor capital allocation. As long as US activity remains resilient relative to Europe and parts of Asia, global capital is likely to continue prioritizing stability and cash flow visibility over higher growth but less predictable alternatives.
Europe and China Diverged Sharply in Domestic Demand Momentum
Economic data released through late November and December 2025 highlighted a widening divergence between Europe and China in domestic demand conditions. While both regions faced growth headwinds, the sources and market implications differed materially. Europe’s slowdown was concentrated in consumption and industrial activity amid tight financial conditions, whereas China’s weakness reflected persistent property sector drag and uneven household confidence despite policy support.
In Europe, incoming data pointed to subdued domestic demand through year end. Retail sales volumes remained soft across major economies, with Germany and France showing flat to mildly negative sequential trends into November. Industrial production data also continued to lag, reflecting weak manufacturing orders and limited inventory rebuilding. These outcomes coincided with restrictive credit conditions, where higher borrowing costs weighed on household spending and capital investment. The result was a growth profile that struggled to generate internal momentum even as external demand stabilized modestly.
China’s slowdown followed a different pattern. Official data showed uneven consumption recovery, with services spending improving modestly while goods demand remained constrained. Fixed asset investment continued to be dragged down by the property sector, where new starts and sales volumes stayed weak through December. Policy measures implemented earlier in 2025 provided targeted support, but transmission into household confidence remained limited. This led to growth outcomes that relied more heavily on public sector intervention than on organic demand.
Market reactions reflected this divergence. European equities and credit markets priced in subdued earnings visibility tied to weak domestic demand, while Chinese assets remained sensitive to policy signaling rather than data surprises. Capital flows responded accordingly. Investors reduced exposure to regions where growth deceleration appeared structural and difficult to reverse in the near term, while selectively allocating toward markets offering clearer policy backstops or external demand exposure.
Structurally, December underscored that global growth fragmentation is not solely about headline growth rates. Month specific data revealed that the composition of growth mattered more than the level. Europe’s demand slowdown reflected cyclical and financial constraints, whereas China’s weakness remained tied to sector specific imbalances. As these dynamics persist, capital allocation is likely to continue differentiating between regions based on demand quality and policy transmission rather than on aggregate growth figures.
Capital Allocation Favored Policy Credibility Over Headline Growth
Capital flows in December 2025 reflected a clear preference for policy credibility and institutional predictability rather than headline growth rates. Across regions, markets differentiated less on short term activity surprises and more on the perceived reliability of monetary and fiscal frameworks. This shift shaped cross border allocation decisions in equities, credit, and currencies during the month.
In the United States, steady policy communication and a transparent reaction function supported continued foreign demand for dollar assets. Despite higher long term yields earlier in the quarter, US credit and equity markets attracted inflows as investors prioritized earnings visibility and legal certainty. Treasury market depth and the scale of the US corporate bond market reinforced this effect, allowing global capital to be absorbed without sharp price dislocations.
By contrast, capital allocation toward Europe remained selective. While policy institutions retained credibility, tighter financial conditions and limited fiscal flexibility constrained the growth outlook. Investors favored segments with clearer regulatory frameworks and balance sheet strength, while remaining cautious toward domestically exposed cyclicals. The result was uneven inflows that tracked institutional strength more closely than macro momentum.
In Asia, the contrast was most evident between Japan and China. Japan benefited from a predictable policy environment and incremental normalization, which supported sustained foreign participation in equity markets despite modest growth. China, meanwhile, saw capital flows remain sensitive to policy announcements rather than realized data. Measures aimed at stabilizing growth reduced downside risk but did not materially improve confidence in transmission, leading investors to demand higher compensation for uncertainty or to remain on the sidelines.
Structurally, December highlighted that fragmented global growth channels capital toward jurisdictions where policy credibility reduces uncertainty premia. Month specific allocation patterns showed that stable frameworks can offset slower growth, while higher headline growth without reliable transmission struggles to attract durable investment. As global activity remains uneven, capital allocation is likely to continue favoring institutional clarity and policy consistency over raw growth differentials.
What to Watch For Next Month
January data releases will clarify whether December’s market dynamics were transitional or indicative of a more durable regime. In rates, attention will center on whether long term yields stabilize or remain volatile as updated inflation and labor market data feed into term premia rather than policy rate expectations. Markets will be sensitive to whether yield movements continue to reflect supply and duration dynamics instead of shifts in the near term growth outlook.
In credit, the key focus will be on whether spread stability persists as issuance resumes following year end seasonality. Investment grade supply calendars and investor reception will offer an early signal of whether credit markets continue to absorb macro volatility without repricing risk premia. Any material widening would likely be driven by issuer specific stress rather than broad macro deterioration, making dispersion an important indicator to monitor.
Equity markets will be watched for further evidence of duration driven rotation. Style and sector performance will indicate whether valuation sensitivity to long term discount rates remains the dominant driver or whether earnings revisions begin to play a larger role. Outside the United States, relative equity performance will continue to act as a proxy for capital allocation decisions in a fragmented global growth environment.
Finally, incoming data from Europe and China will be assessed less on headline growth and more on signs of improved domestic demand transmission. Markets will focus on whether policy measures translate into measurable stabilization in consumption and investment, as this will shape global capital flows more than marginal changes in growth rates.
Closing Remarks
December 2025 underscored a market environment defined by repricing rather than crisis. Duration risk was redistributed across asset classes, with equities and credit absorbing pressure through relative valuation and selective issuance instead of broad dislocations. Credit markets continued to function as a stabilizing channel, while global capital allocation reflected widening differences in growth quality and policy credibility.
The common thread across asset classes was differentiation. Markets rewarded cash flow visibility, balance sheet strength, and institutional predictability while penalizing assets with greater sensitivity to long dated discount rates or uncertain policy transmission. These dynamics reinforced the importance of analyzing market signals through the lens of structure and composition rather than relying solely on headline performance.
As the new year begins, the durability of these patterns will depend on whether macro volatility remains rate driven or begins to intersect with growth fundamentals. For now, December’s price action suggests that markets remain capable of adjusting internally, reallocating risk across styles, sectors, and regions without signaling a breakdown in underlying financial conditions.