
Monthly Market Memorandum - January 2026

Contents
Executive Summary
Macro & Market Overview
2.1 Inflation & Rates
2.2 Global Economic Activity
2.3 Equity Markets
2.4 Fixed Income & Credit
2.5 Commodities & Alternatives
Key Themes of the Month
3.1 The Persistence of Higher-for-Longer Yields
3.2 U.S. Dominance and Narrow Market Leadership
3.3 Resilient Credit in a Slowing Growth Environment
What to Watch Next Month
Closing Remarks
Executive Summary
January 2026 markets moved higher, but the bigger story sat in rates, credit, and energy.
US equities posted modest gains. The S&P 500 rose 0.89%, ending January 30 at 6,939.03 versus 6,878.11 on January 2. The Nasdaq Composite gained 0.97%, finishing January 30 at 23,461.82 versus 23,235.63 on January 2. Headline index performance looked calm, but rates and commodities once again shaped the undercurrent.
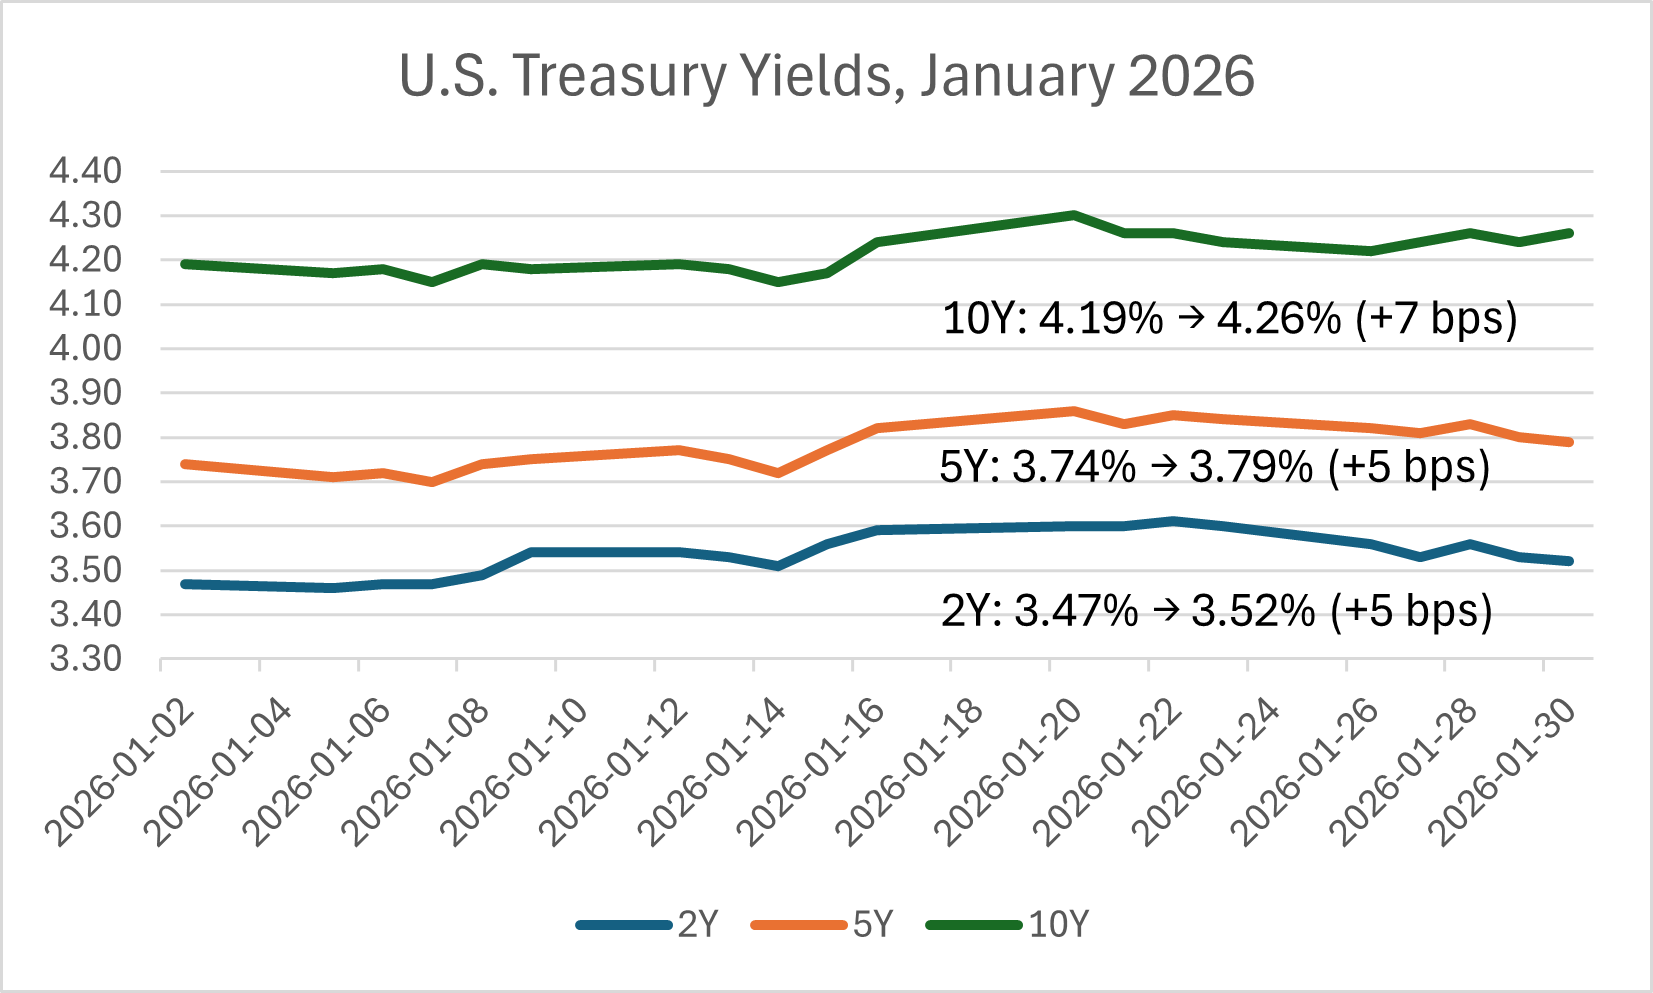
Rates drifted higher across the curve. The 2 year US Treasury yield increased from 3.47% on January 2 to 3.52% on January 30, up 5 basis points. The 10 year yield moved from 4.19% to 4.26%, up 7 basis points. Higher yields kept valuation pressure on long duration assets even as equity indices advanced.
Credit stayed constructive and helped offset the rise in risk free yields. Investment grade spreads tightened from 0.79% on January 2 to 0.74% on January 30. High yield spreads tightened from 2.83% to 2.80%. Tightening spreads signaled that investors maintained confidence in corporate balance sheets and default risk, which kept financing conditions supportive despite higher long term yields.
Commodities moved sharply, led by energy. WTI crude oil climbed from 57.21 dollars per barrel on January 2 to 64.50 dollars per barrel on January 30, a 12.74% increase. The rebound in energy prices reintroduced near term upside risk to the inflation narrative.
Three themes defined January’s setup going into February. First, risk assets held up even as yields rose, so markets treated higher rates as a headwind rather than a stop sign. Second, credit kept acting as the shock absorber, with spreads tightening instead of widening. Third, energy regained influence over macro expectations and can force faster repricing when inflation data hits.
Macro & Market Overview
Inflation & Rates
Inflation data released in January indicated that price pressures eased modestly compared with late 2025, but core inflation remained above trend. Headline CPI in the United States rose at a slower pace year over year, with energy price rebounds contributing more to monthly variability than broad goods and services inflation. Core CPI continued to run above the Federal Reserve’s long-term target, reflecting persistent shelter and services price growth even as goods inflation softened.
Against this backdrop, U.S. monetary policy expectations remained anchored but adaptive. Federal Reserve communications in January emphasized data dependency, signaling openness to future rate adjustments while underscoring that inflation progress remained uneven. Markets continued to price a path of limited policy easing over the coming quarters, with implied Fed funds futures suggesting a gradual shift rather than abrupt policy change. In Europe, the European Central Bank maintained its key policy rate steady, noting that inflation remained close to target but uneven across member states. The Bank of Japan also left its policy rate unchanged, continuing its measured approach to normalization.

Daily yields for 2 year, 5 year, and 10 year U.S. Treasury securities from January 2 to January 30, 2026. The figure shows a modest increase across maturities, with longer term yields rising more than short term yields, resulting in a moderate steepening of the yield curve.
Bond markets responded by adjusting yields along the U.S. Treasury curve. Short-term yields rose modestly as markets priced a slower pace of easing, while longer-term yields increased more substantially, reflecting stronger growth expectations and term premium influences. The 2-year U.S. Treasury yield ended the month modestly higher, signaling that markets saw limited immediate policy relief. The 10-year yield climbed further, driven by a mix of stronger growth sentiment, higher government bond supply, and persistent inflation uncertainty. As a result, the U.S. yield curve steepened moderately over the month.
For markets, January reinforced that inflation progress remains central to interest rate expectations. Although headline price increases moderated, core inflation’s persistence limited the degree of policy easing priced into markets. The steeper yield curve reflected a balance between inflation uncertainty and growth prospects, which in turn continued to influence valuation multiples across risk assets and informed positioning in both equity and credit markets.
-
US Headline CPI (CPIAUCSL)
https://fred.stlouisfed.org/series/CPIAUCSL
US Core CPI (CPILFESL)
https://fred.stlouisfed.org/series/CPILFESL
US 2 Year Treasury Yield (DGS2)
https://fred.stlouisfed.org/series/DGS2
US 5 Year Treasury Yield (DGS5)
https://fred.stlouisfed.org/series/DGS5
US 10 Year Treasury Yield (DGS10)
https://fred.stlouisfed.org/series/DGS10
Federal Funds Target Rate
https://fred.stlouisfed.org/series/DFEDTARU
Federal Reserve Policy Statements
https://www.federalreserve.gov/monetarypolicy/fomccalendars.htm
European Central Bank Key Interest Rates
https://www.ecb.europa.eu/stats/policy_and_exchange_rates/key_ecb_interest_rates/html/index.en.html
Bank of Japan Policy Rates
https://www.boj.or.jp/en/statistics/boj/other/discount/index.htm
Global Economic Activity
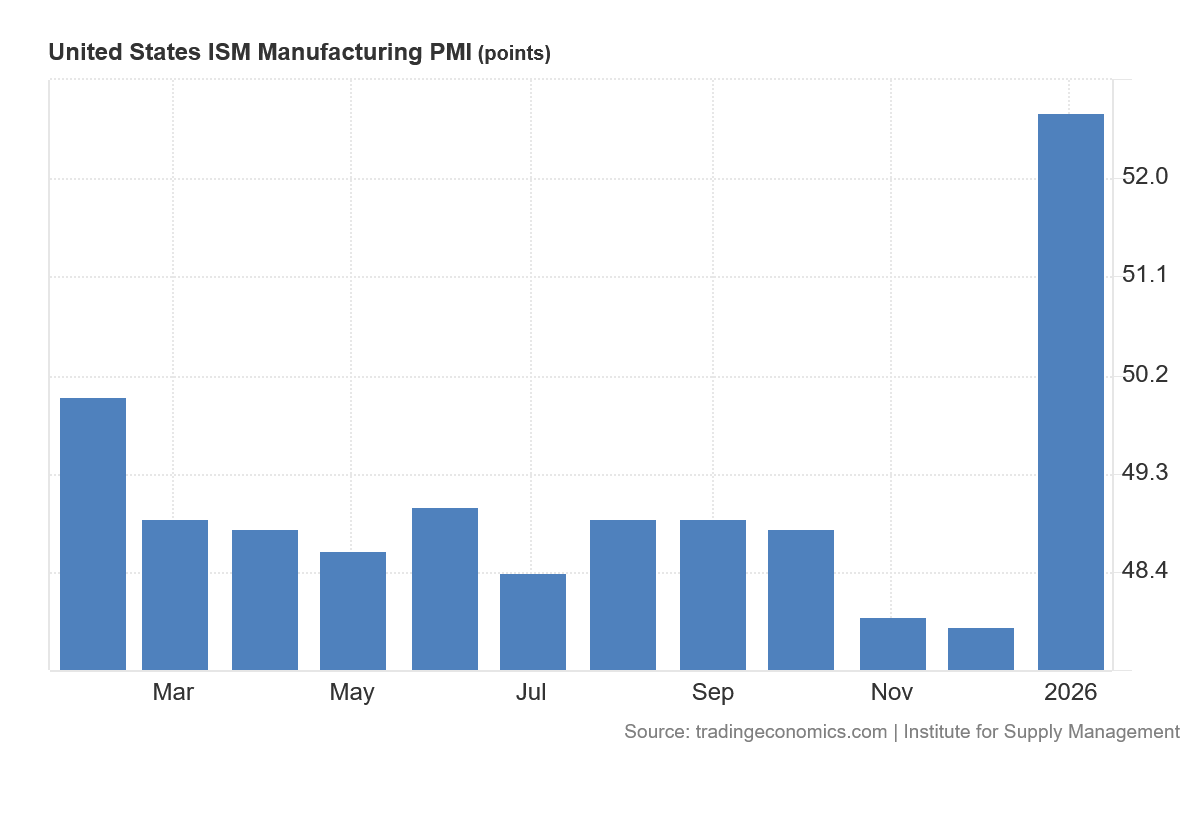
Global economic activity in January 2026 continued to reflect uneven momentum across major regions, with persistent weakness in manufacturing offset by greater resilience in services and labor markets. Global manufacturing indicators remained below long term averages, with composite PMI readings clustered near the 49 to 50 range, signaling ongoing contraction rather than stabilization. At the same time, global services activity remained in expansion, helping prevent a broader slowdown in output and demand. This divergence reinforced the late 2025 pattern of slowing but stable growth, in which industrial sectors weakened while consumption and service oriented activity provided partial support.
In the United States, manufacturing activity remained subdued. The ISM Manufacturing PMI registered below 50 in January, extending a contractionary trend that persisted for much of 2025. New orders and production subindices remained weak, reflecting slower domestic demand and soft export growth. Capital expenditure indicators also showed caution, as higher borrowing costs continued to constrain investment in equipment and facilities. However, services activity remained more resilient, with the ISM Services PMI staying above 52, supported by continued consumer spending and stable labor market conditions. The U.S. unemployment rate remained below 4%, helping sustain household income and limiting the spillover from manufacturing weakness into broader economic activity.
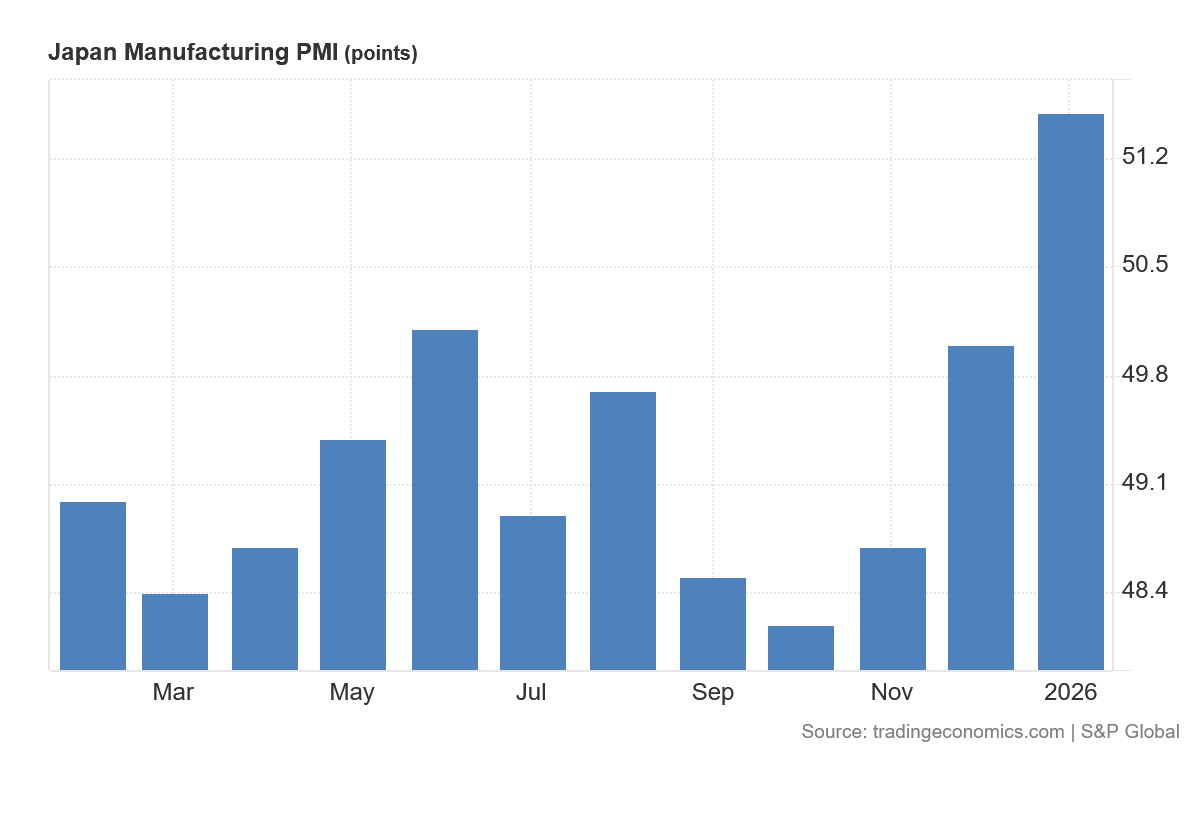
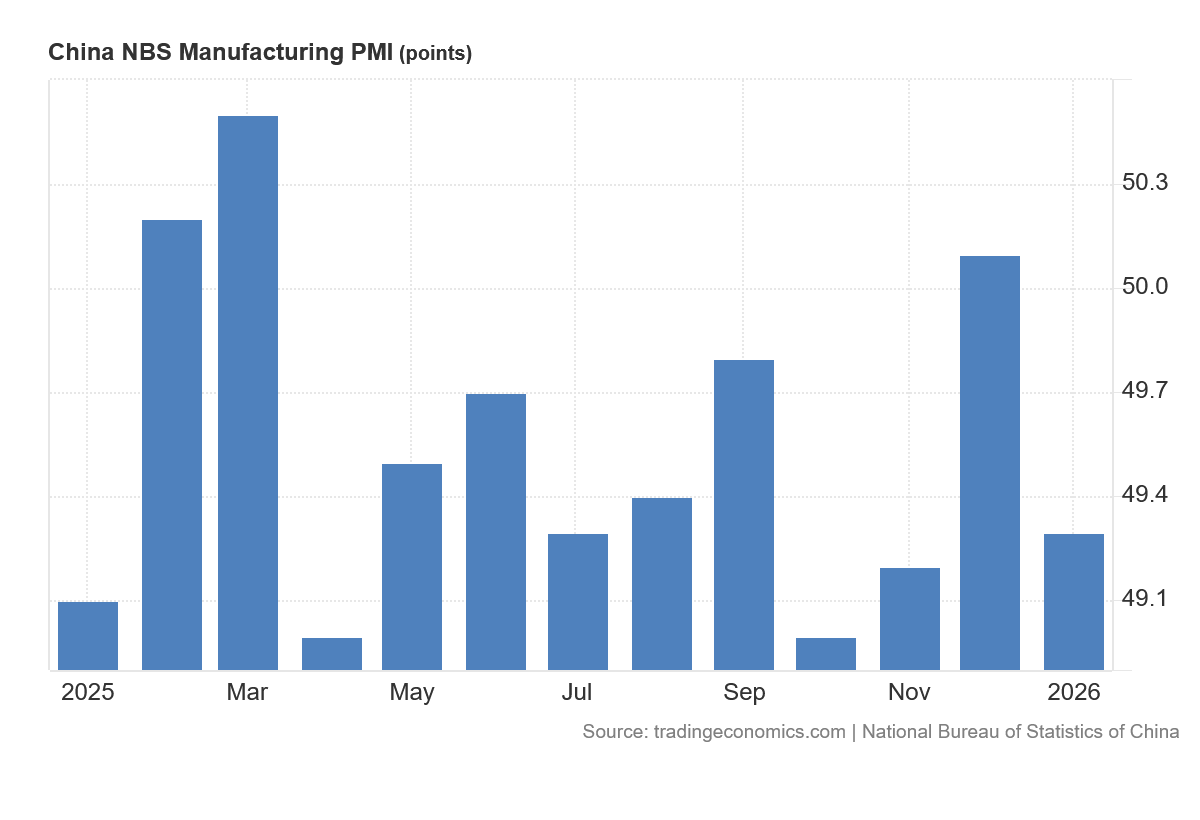
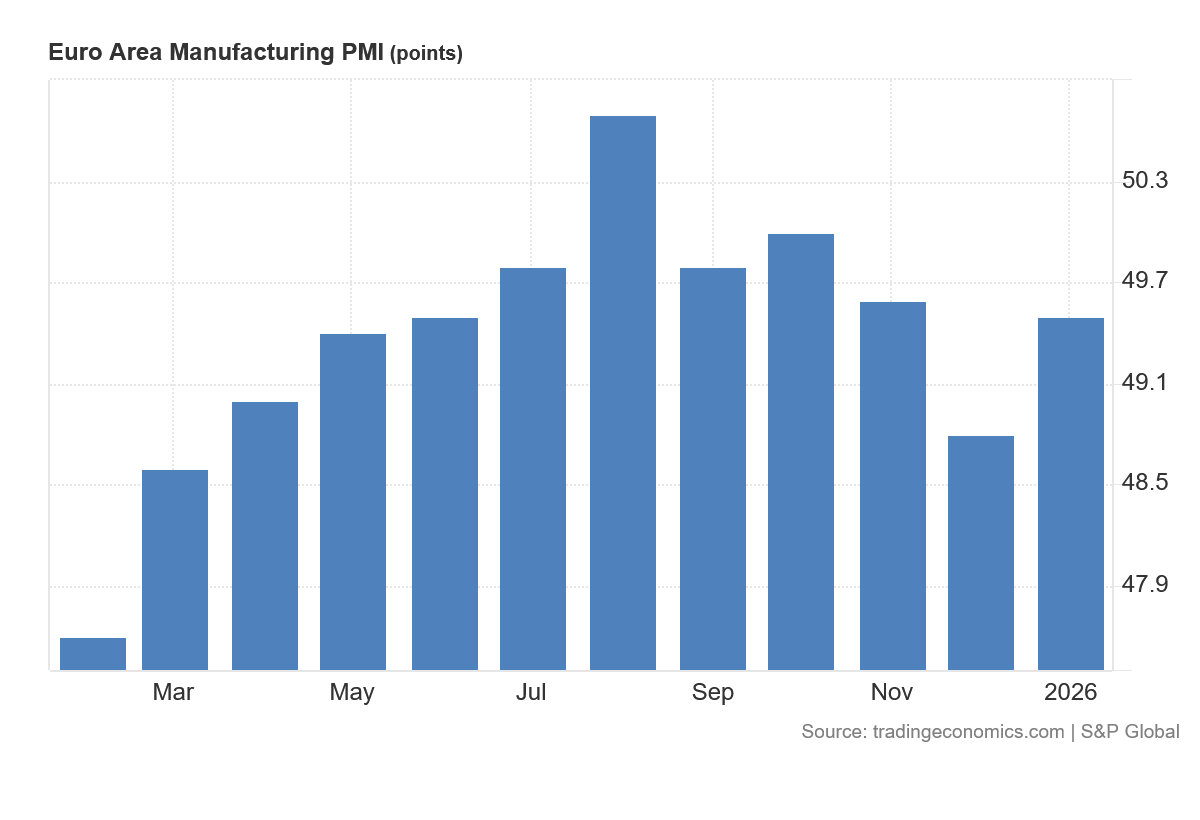
Outside the United States, growth conditions were more fragile. Euro area manufacturing PMI remained in contraction territory in January, with readings in the mid to high 40s reflecting weak industrial output and declining export demand. Germany, in particular, continued to face pressure from subdued global trade and elevated financing costs. In China, official manufacturing PMI readings remained close to 49, indicating limited improvement despite targeted policy support and infrastructure spending. Property sector weakness and cautious consumer behavior continued to weigh on domestic demand. Japan’s manufacturing PMI also stayed below 50, reflecting weaker external demand and rising input costs linked to currency depreciation and wage growth. Across these regions, the lack of sustained improvement suggested that manufacturing weakness remained structural rather than cyclical.
For markets, January’s growth data implied limited near term upside to global economic momentum. Persistent manufacturing contraction constrained earnings growth in industrial, materials, and export oriented sectors, while services resilience supported consumer and defensive segments. Credit markets continued to price manageable default risk, reflecting stable employment conditions and moderate corporate leverage. Commodity demand remained subdued outside energy, reinforcing caution around industrial metals and bulk materials. Looking ahead, the key risk is whether prolonged industrial weakness begins to affect employment and service sector activity. A deterioration in labor markets would likely trigger a broader slowdown, while continued resilience would support a gradual, low growth expansion rather than a sharp downturn.
-
United States ISM Manufacturing PMI
https://www.ismworld.org/supply-management-news-and-reports/reports/ism-report-on-business/
Trading Economics – United States Manufacturing PMI
https://tradingeconomics.com/united-states/manufacturing-pmi
Trading Economics – Euro Area Manufacturing PMI
https://tradingeconomics.com/euro-area/manufacturing-pmi
Trading Economics – China Manufacturing PMI
https://tradingeconomics.com/china/manufacturing-pmi
Trading Economics – Japan Manufacturing PMI
https://tradingeconomics.com/japan/manufacturing-pmi
S&P Global PMI Releases
https://www.pmi.spglobal.com/Public/Home/PressRelease
National Bureau of Statistics of China
Equity Markets
Global equity markets in January 2026 delivered mixed performance, with leadership concentrated in the United States while several international markets lagged. Performance dispersion reflected differences in growth momentum, sector composition, and sensitivity to interest rates. U.S. large cap indices continued to benefit from earnings resilience and technology exposure, while European and Chinese equities faced pressure from weaker industrial activity and slower domestic demand.
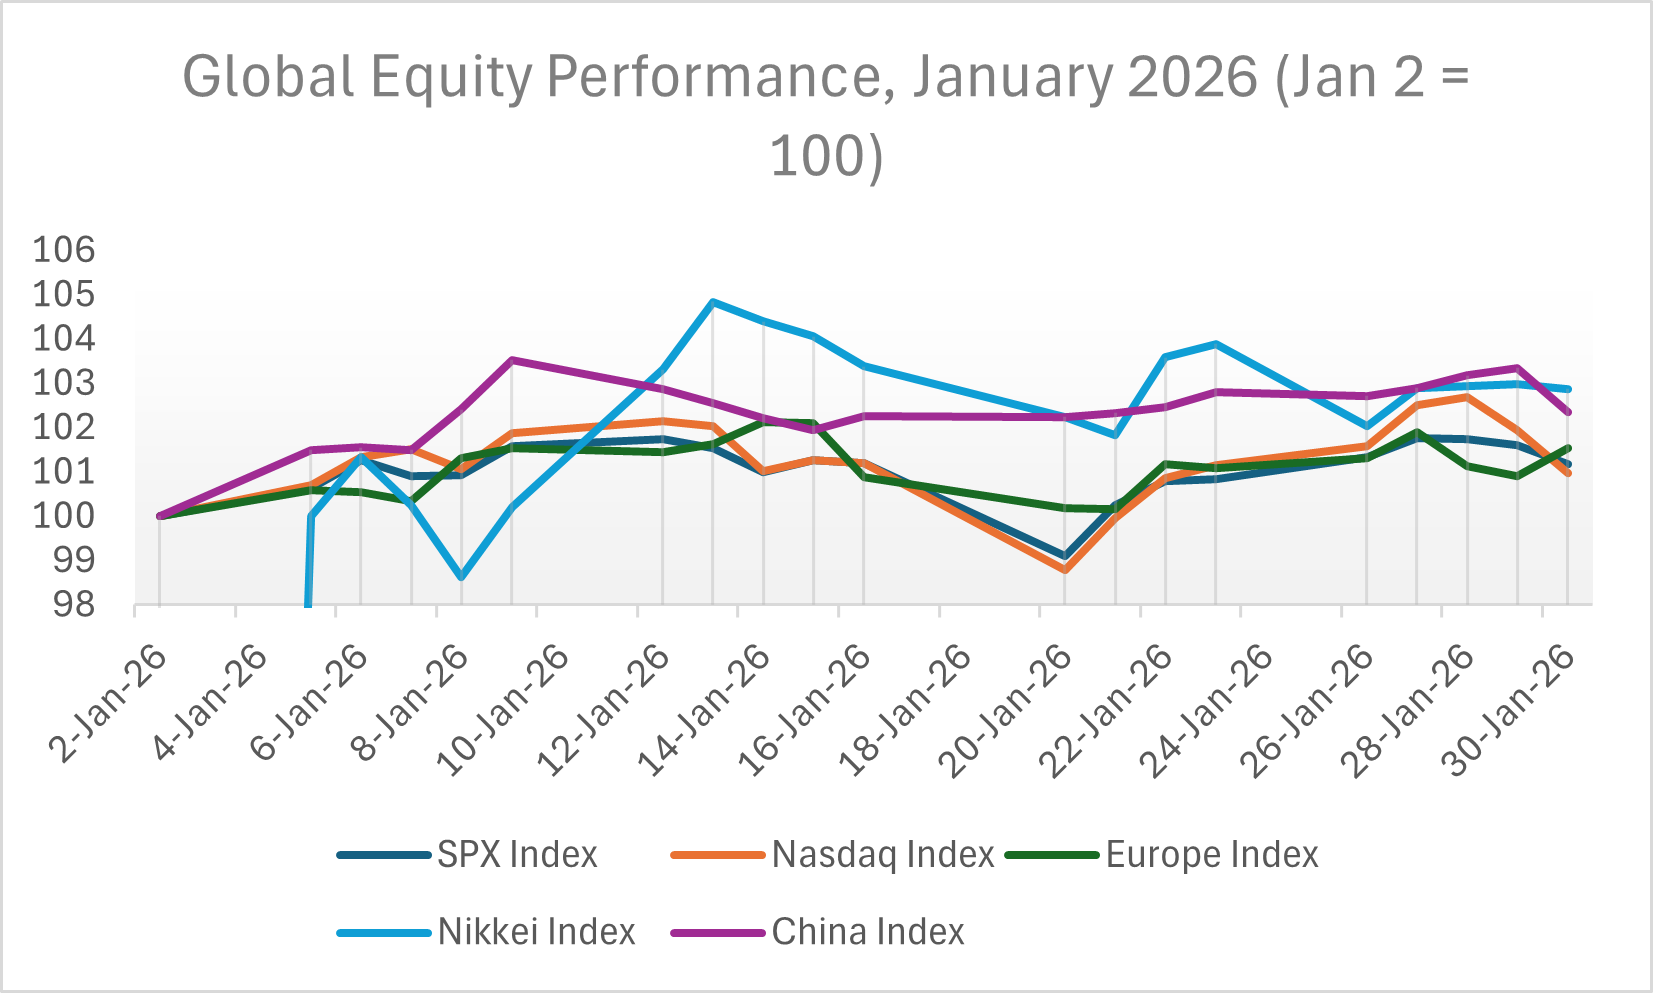
Indexed performance of major equity benchmarks from January 2 to January 30, 2026. U.S. equity indices outperformed most international markets, reflecting stronger earnings momentum and sector composition advantages.
In the United States, major indices advanced during the month. The S&P 500 rose modestly over the January 1 to January 31 period, supported by strength in information technology, communication services, and select consumer discretionary names. The Nasdaq Composite outperformed broader benchmarks, reflecting continued investor preference for large cap growth companies amid stable earnings expectations and contained volatility. The VIX index remained in the mid teens for most of the month, indicating limited near term risk repricing. Sector performance remained uneven, with financials supported by higher long term yields, while utilities and real estate lagged amid persistent discount rate pressure.
Outside the United States, equity performance was more fragile. European indices showed limited upside as manufacturing contraction and slower export demand constrained earnings momentum. The STOXX Europe 600 remained sensitive to industrial and financial sector exposure. In China, equity markets remained under pressure, reflecting ongoing property sector stress and cautious consumer sentiment. Japanese equities performed more constructively, supported by corporate governance reforms and improved return on equity trends, although rising domestic bond yields introduced valuation headwinds.
Overall, January’s equity performance reinforced the dominance of U.S. markets within global capital allocation. Earnings stability and sector composition continued to favor U.S. large cap benchmarks relative to international peers. For markets, the key question remains whether global growth stabilizes sufficiently to broaden equity participation beyond U.S. technology and large cap sectors. If manufacturing weakness persists, performance dispersion across regions and styles is likely to remain elevated, favoring higher quality and earnings resilient companies.
-
S&P 500 Historical Data
https://finance.yahoo.com/quote/%5EGSPC/history
Nasdaq Composite Historical Data
https://finance.yahoo.com/quote/%5EIXIC/history
STOXX Europe 600
https://finance.yahoo.com/quote/%5ESTOXX
Nikkei 225
https://finance.yahoo.com/quote/%5EN225/history
Shanghai Composite
https://finance.yahoo.com/quote/000001.SS/history
VIX Index
Fixed Income and Credit
Fixed income markets in January 2026 reflected continued divergence between interest rate risk and credit risk. While short and long term government bond yields remained elevated, credit spreads stayed relatively tight, indicating that investors remained comfortable with corporate balance sheet risk. This separation reinforced the view that markets were more concerned about duration exposure than about near term default risk.
In the United States, Treasury yields showed modest upward pressure across the curve. The 2 year yield increased over the month, reflecting expectations that policy easing would remain gradual rather than rapid. The 10 year yield also moved higher, supported by persistent government bond supply and firm long term growth expectations. As a result, the yield curve remained relatively flat, with limited evidence of aggressive steepening or inversion. This environment continued to challenge long duration fixed income assets, as higher yields reduced bond prices and limited total returns.
Daily 2 year and 10 year U.S. Treasury yields from January 1 to January 31, 2026, showing continued upward pressure and limited curve steepening.
Despite higher risk free rates, credit markets remained resilient. Investment grade corporate bond spreads remained near cycle lows, while high yield spreads showed only limited widening. This indicated that investors continued to view corporate default risk as manageable, supported by stable earnings, moderate leverage levels, and resilient labor markets. Higher base rates also supported carry returns, making corporate credit attractive despite limited scope for further spread compression.
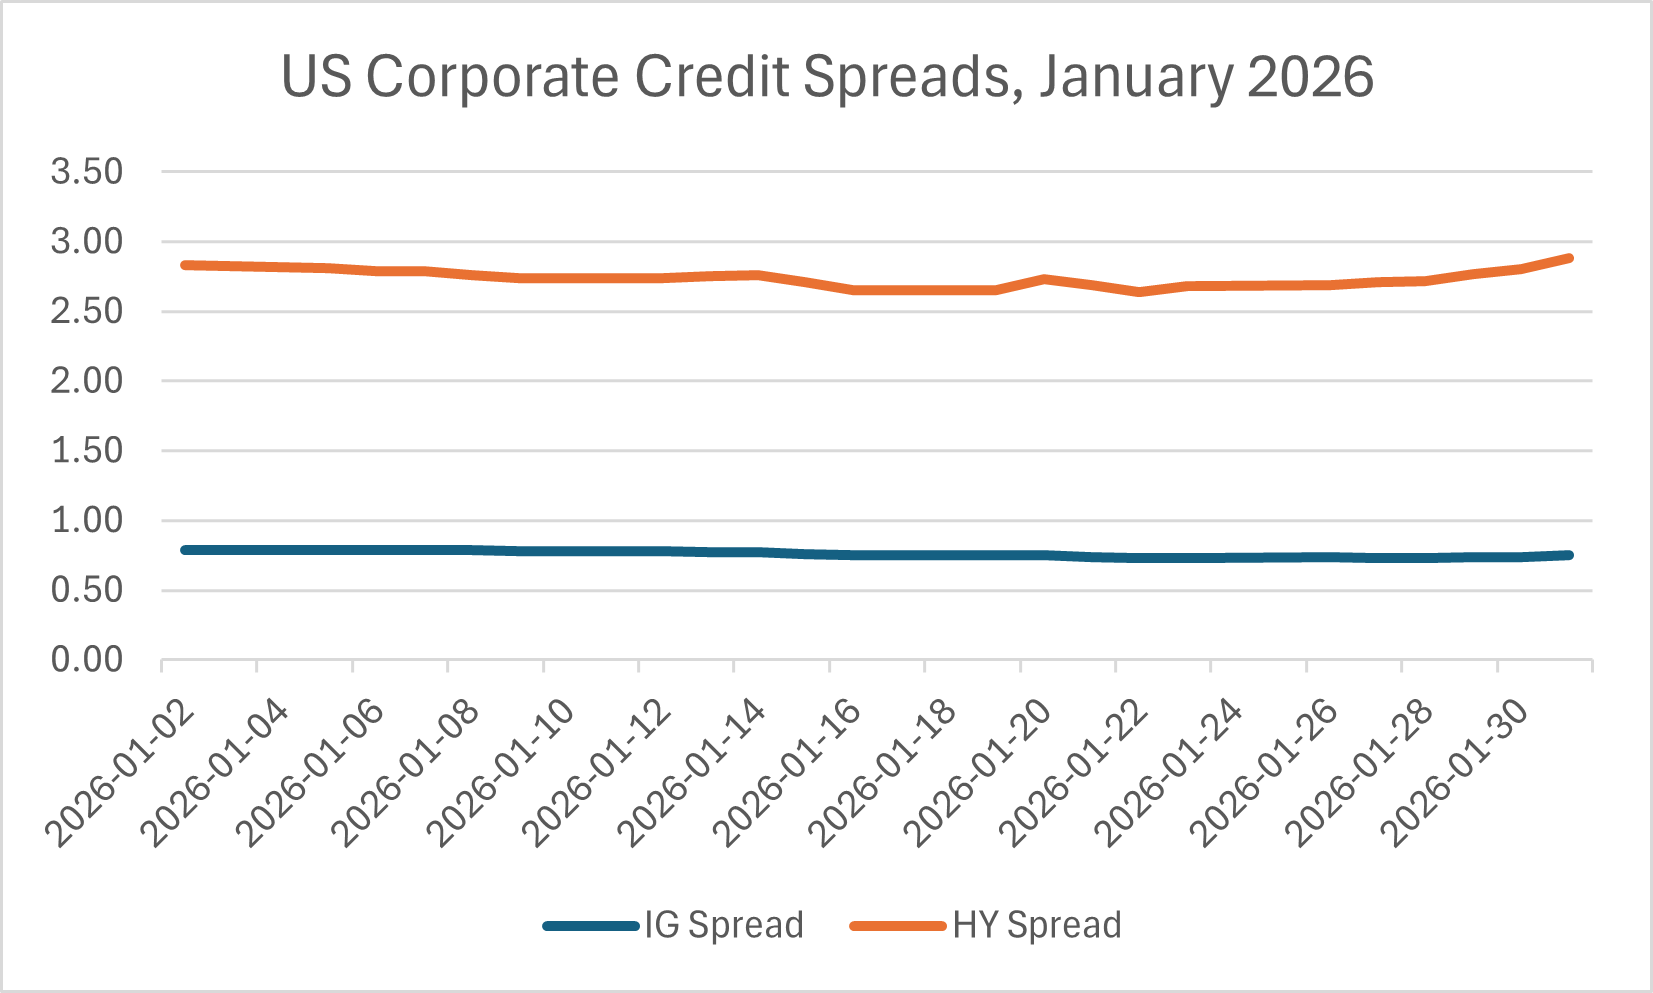
Investment grade and high yield option adjusted spreads during January 2026, indicating continued resilience in corporate credit markets despite elevated interest rates.
Outside the United States, fixed income trends broadly mirrored global developments. Canadian government bond yields tracked U.S. Treasuries closely, reflecting strong cross border capital linkages. European sovereign yields remained sensitive to weak growth and fiscal pressures, while credit spreads remained contained despite slowing industrial activity. Overall, January’s fixed income data suggested that financial conditions remained restrictive but stable. For markets, this implied continued preference for shorter duration and higher quality credit exposure, while long duration government bonds remained vulnerable to further yield volatility.
-
US 2 Year Treasury Yield (DGS2)
https://fred.stlouisfed.org/series/DGS2
US 10 Year Treasury Yield (DGS10)
https://fred.stlouisfed.org/series/DGS10
US Investment Grade Corporate Spread (ICE BofA OAS) https://fred.stlouisfed.org/series/BAMLCOA0CM
US High Yield Corporate Spread (ICE BofA OAS) https://fred.stlouisfed.org/series/BAMLH0AOHYM2
Canada 10 Year Government Bond Yield
https://fred.stlouisfed.org/series/IRLTLT01CAM156N
Euro Area 10 Year Government Bond Yield
Commodities & Alternatives
Commodity markets in January 2026 reflected continued caution around global demand alongside easing near term inflation pressure. Energy and industrial metals prices remained sensitive to manufacturing weakness and trade conditions, while precious metals continued to benefit from interest rate uncertainty and fiscal concerns. Alternative assets remained shaped primarily by elevated financing costs rather than cyclical growth momentum.
Energy prices showed limited upside during the month. West Texas Intermediate crude oil traded within a narrow range, reflecting soft global manufacturing activity and limited evidence of demand acceleration from China and Europe. OPEC+ production discipline helped limit downside risk, but stable supply conditions and elevated inventories constrained price gains. Natural gas prices remained subdued, supported by strong domestic production and relatively mild winter demand, further reducing near term inflation pressure from energy inputs.
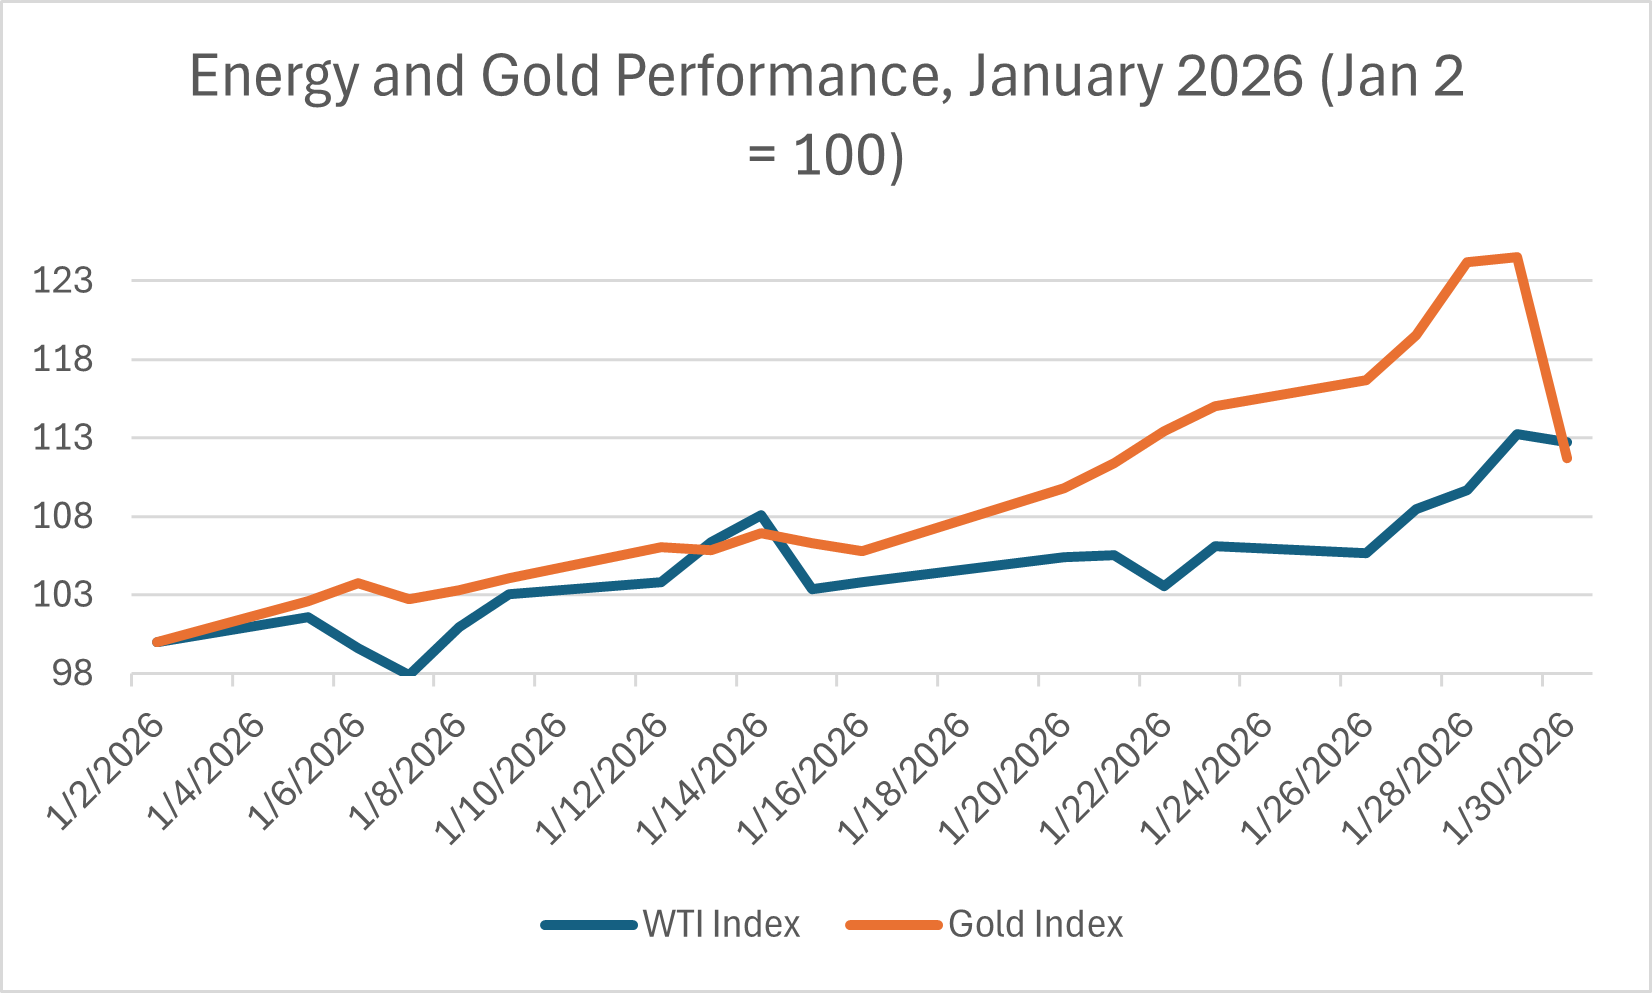
Indexed performance of WTI crude oil and gold prices from January 2 to January 30, 2026. Energy prices reflected subdued demand conditions, while gold remained supported by interest rate and fiscal uncertainty.
Industrial metals performance remained mixed. Copper prices fluctuated within a narrow band, reflecting weak construction and manufacturing demand offset by longer term electrification and infrastructure investment expectations. Iron ore prices remained under pressure due to continued weakness in China’s property sector, limiting steel demand and weighing on bulk commodity exporters. Agricultural commodities showed limited net movement, as balanced supply conditions and the absence of major weather disruptions kept prices relatively stable.
Precious metals and alternative assets reflected heightened sensitivity to interest rates and macro uncertainty. Gold prices remained supported despite elevated long term yields, benefiting from concerns around fiscal sustainability and geopolitical risk. Real assets such as commercial real estate and infrastructure continued to face valuation pressure from higher discount rates and refinancing costs. Private market activity remained selective, with private equity and private credit strategies emphasizing capital preservation and yield generation over leverage driven returns. For markets, this environment favored selective exposure to defensive commodities and income oriented alternatives rather than broad cyclical positioning.
-
WTI Crude Oil Prices
https://fred.stlouisfed.org/series/DCOILWTICO
Brent Crude Oil Prices
https://fred.stlouisfed.org/series/DCOILBRENTEU
Gold Price (London Bullion Market, USD) https://fred.stlouisfed.org/series/GOLDAMGBD228NLBM
Copper Prices
https://fred.stlouisfed.org/series/PCOPPUSDM
Natural Gas Prices (Henry Hub)
https://fred.stlouisfed.org/series/DHHNGSP
S&P GSCI Commodity Index
Key Themes of the Month
Theme 1: The Repricing of Duration Risk
Term Premium and Treasury Supply Pressures
A central driver of January’s higher-for-longer yield environment was the sustained elevation in term premia across longer maturity government bonds. Even as policy rate expectations stabilized, the 10 year U.S. Treasury yield remained elevated relative to the 2 year yield, indicating that investors demanded greater compensation for holding duration risk. This dynamic reflected structural concerns rather than near term inflation data alone. Expanding federal deficits required continued Treasury issuance across intermediate and long maturities, increasing supply at a time when traditional demand sources showed signs of moderation. January auction results revealed mixed bid-to-cover ratios for longer tenor securities, suggesting that private investors required higher yields to absorb incremental supply.
This supply-driven repricing signaled a broader shift in how markets assessed fiscal sustainability and long run borrowing needs. Elevated issuance expectations reduced confidence that long term yields would mechanically follow policy rates lower. Instead, investors began pricing a structural premium for fiscal uncertainty and persistent government financing requirements. As a result, even modest improvements in inflation data failed to generate sustained downward pressure on long term rates. For markets, this reinforced the idea that duration risk remained exposed to fiscal dynamics rather than solely to central bank guidance, limiting the upside for long maturity bonds and constraining valuation expansion in rate-sensitive asset classes.
Global Capital Flows and Policy Divergence
Beyond domestic fiscal dynamics, global capital flows reinforced January’s higher-for-longer yield environment. Monetary policy divergence, particularly in Japan, altered cross-border investment incentives and reduced structural demand for foreign sovereign bonds. As the Bank of Japan continued its gradual normalization process, Japanese government bond yields moved higher relative to prior years. Even modest increases in domestic yields reduced the attractiveness of funding trades that had historically supported demand for U.S. and European long-duration assets. Investors who previously borrowed in yen to purchase higher-yielding foreign bonds faced narrower interest rate differentials and rising currency risk, leading to a moderation in outward capital flows.
This shift in cross-border positioning had measurable implications for global bond markets. Japan has long been a major holder of foreign sovereign debt, particularly U.S. Treasuries. As domestic yields rose and currency volatility increased, incentives to repatriate capital strengthened. At the same time, European fiscal expansion and increased sovereign issuance reduced the capacity of global investors to absorb additional supply without yield concessions. The result was a structural adjustment in global bond demand rather than a temporary cyclical response. Long-term yields increasingly reflected reduced foreign demand elasticity and higher global financing needs. For investors, this dynamic underscored that long-term rates were being shaped not only by domestic inflation expectations but also by shifting international capital allocation patterns, reinforcing the persistence of elevated borrowing costs despite easing policy narratives.
Valuation Effects and Investment Behavior
Elevated long term yields in January translated directly into valuation constraints across multiple asset classes. Higher discount rates limited the scope for multiple expansion in growth-oriented equities, even where earnings remained stable. Sectors with long duration cash flows, including technology, infrastructure, and real estate, faced greater sensitivity to changes in long term rates. While equity indices remained resilient overall, performance dispersion reflected rate exposure rather than broad-based earnings deterioration. Companies with nearer-term cash flows and stronger balance sheets generally outperformed those reliant on distant growth projections.
Beyond public markets, higher-for-longer borrowing costs influenced investment behavior in private and real asset markets. Infrastructure projects, commercial real estate transactions, and leveraged buyouts faced increased financing hurdles, as refinancing costs remained materially above levels seen earlier in the cycle. Private equity deal volumes remained selective, and return expectations adjusted upward to reflect elevated funding costs. In fixed income portfolios, investor positioning favored shorter duration exposure and carry-oriented strategies over long maturity government bonds. This behavioral shift indicated that market participants were adapting to a structurally higher rate environment rather than anticipating an imminent reversion to prior ultra-low yield conditions.
Taken together, the persistence of elevated long term yields reshaped asset allocation decisions across public and private markets. Rather than viewing policy easing as a catalyst for immediate valuation expansion, investors increasingly focused on duration sensitivity, cash flow stability, and balance sheet resilience. This adaptation reinforced the broader January theme: structural forces, including fiscal dynamics and global capital flows, exerted greater influence on long term rates than short term central bank signaling. As long as this dynamic persists, valuation-sensitive sectors are likely to remain constrained despite incremental improvements in inflation or policy guidance.
-
US 2 Year Treasury Yield (FRED)
https://fred.stlouisfed.org/series/DGS2
US 10 Year Treasury Yield (FRED)
https://fred.stlouisfed.org/series/DGS10
US Treasury Auction Results
https://www.treasurydirect.gov/auctions/announcements-data-results/
Japan 10 Year Government Bond Yield (FRED)
https://fred.stlouisfed.org/series/IRLTLT01JPM156N
Euro Area 10 Year Government Bond Yield (FRED)
https://fred.stlouisfed.org/series/IRLTLT01EZM156N
Federal Reserve FOMC Statements
https://www.federalreserve.gov/monetarypolicy/fomccalendars.htm
Bank of Japan Monetary Policy Statements
Global Capital Flows and Policy Divergence
Beyond domestic fiscal dynamics, global capital flows reinforced January’s higher-for-longer yield environment. Monetary policy divergence, particularly in Japan, altered cross-border investment incentives and reduced structural demand for foreign sovereign bonds. As the Bank of Japan continued its gradual normalization process, Japanese government bond yields moved higher relative to prior years. Even modest increases in domestic yields reduced the attractiveness of funding trades that had historically supported demand for U.S. and European long-duration assets. Investors who previously borrowed in yen to purchase higher-yielding foreign bonds faced narrower interest rate differentials and rising currency risk, leading to a moderation in outward capital flows.
This shift in cross-border positioning had measurable implications for global bond markets. Japan has long been a major holder of foreign sovereign debt, particularly U.S. Treasuries. As domestic yields rose and currency volatility increased, incentives to repatriate capital strengthened. At the same time, European fiscal expansion and increased sovereign issuance reduced the capacity of global investors to absorb additional supply without yield concessions. The result was a structural adjustment in global bond demand rather than a temporary cyclical response. Long-term yields increasingly reflected reduced foreign demand elasticity and higher global financing needs. For investors, this dynamic underscored that long-term rates were being shaped not only by domestic inflation expectations but also by shifting international capital allocation patterns, reinforcing the persistence of elevated borrowing costs despite easing policy narratives.
Concentration in Large-Cap Technology and AI Leaders
A central feature of January’s equity performance was the continued dominance of large-cap technology and AI-related companies within U.S. indices. A small group of firms accounted for a significant share of index-level returns, reflecting strong earnings expectations, balance sheet strength, and perceived structural growth advantages. These companies benefited from sustained investment in artificial intelligence infrastructure, cloud computing, and digital services, which insulated them from near-term economic volatility.
This concentration intensified valuation dispersion within U.S. markets. While leading technology firms maintained premium multiples, many mid-cap and cyclical companies lagged despite stable fundamentals. Investors appeared willing to pay higher valuations for earnings visibility and scalability, particularly in an environment of elevated discount rates. As a result, index performance increasingly reflected the behavior of a narrow leadership group rather than broad corporate profitability. This raised concerns around concentration risk and reduced the informational value of headline index movements.
Weak International Equity Participation
Outside the United States, equity market participation remained limited. European indices struggled to sustain upward momentum, constrained by weak manufacturing activity, slower earnings growth, and tighter credit conditions. Export-oriented sectors remained vulnerable to subdued global trade, while financials faced pressure from flat yield curves and modest loan growth. Although valuations remained lower than in the U.S., the discount reflected structural growth concerns rather than temporary dislocation.
Chinese equity markets continued to face persistent headwinds. Property sector stress, cautious consumer behavior, and limited confidence in long-term policy effectiveness weighed on investor sentiment. Despite targeted stimulus measures, equity inflows remained subdued, and market performance lagged regional peers. Japanese equities performed more constructively, supported by governance reforms and improved return on equity metrics, but rising domestic bond yields introduced valuation constraints. Overall, international markets lacked a unifying growth narrative capable of attracting sustained global capital.
Capital Flows and Global Portfolio Reallocation
Capital flow patterns in January reflected this growing divergence. Global investors continued reallocating toward U.S. equities, particularly large-cap and growth-oriented segments, at the expense of international and emerging market exposure. Exchange-traded fund flows and institutional portfolio disclosures indicated sustained demand for U.S. assets, driven by liquidity, regulatory stability, and superior earnings transparency.
This reallocation reinforced self-reinforcing dynamics. Strong inflows supported U.S. equity valuations, which in turn attracted additional capital, while weaker performance abroad discouraged incremental investment. Currency considerations also played a role, as dollar strength and relative macro stability reduced perceived risk in U.S. assets. For portfolio managers, this environment favored benchmark-aligned positioning over contrarian diversification. However, it also increased vulnerability to sentiment shifts, as crowded positioning amplified downside risk in the event of earnings disappointments or policy shocks.
Implications
Taken together, January’s equity dynamics reflected a market environment defined by concentration rather than broad participation. U.S. large-cap dominance, weak international engagement, and persistent capital inflows reinforced narrow leadership patterns. For investors, this implied rising exposure to concentration risk and reduced diversification benefits. Unless global growth momentum improved and earnings visibility broadened, equity performance was likely to remain uneven, favoring a limited group of perceived quality leaders over broader market participation.
-
S&P 500 Historical Data (Yahoo Finance) https://finance.yahoo.com/quote/%5EGSPC/history
Nasdaq Composite Historical Data (Yahoo Finance) https://finance.yahoo.com/quote/%5EIXIC/history
STOXX Europe 600 (Yahoo Finance) https://finance.yahoo.com/quote/%5ESTOXX/history
Nikkei 225 (Yahoo Finance)
https://finance.yahoo.com/quote/%5EN225/history
Shanghai Composite (Yahoo Finance) https://finance.yahoo.com/quote/000001.SS/history
CBOE VIX Index (Yahoo Finance)
https://finance.yahoo.com/quote/%5EVIX/history
Global ETF Fund Flows (ETF.com)
https://www.etf.com/etfanalytics/etf-fund-flows-tool
IMF Capital Flows Database
https://data.imf.org/?sk=E3F5F871-EC85-4E24-8EFB-8D3FBD92B5B1
Resilient Credit in a Slowing Growth Environment
January 2026 highlighted a growing divergence between real economic momentum and credit market pricing. While manufacturing indicators and global trade data continued to point to slowing activity, corporate credit spreads remained compressed and default expectations stayed low. This suggested that investors remained confident in corporate balance sheet resilience and near-term earnings stability, despite mounting evidence of cyclical softening. As a result, credit markets projected a benign economic outlook that contrasted with signals from industrial and survey-based indicators.
Rather than responding to weakening growth signals, credit investors continued to prioritize income generation and capital preservation. Elevated base rates supported attractive carry returns, reducing incentives to reprice risk aggressively. This environment reinforced the perception that moderate growth deceleration could be absorbed without triggering widespread financial stress. January’s credit behavior therefore reflected confidence in corporate adaptability rather than complacency toward macroeconomic risks.
Tight Spreads and Carry Trade Dominance
A defining feature of January’s credit environment was the persistence of tight credit spreads. U.S. investment grade and high yield option-adjusted spreads remained near the lower end of their post-pandemic ranges, despite elevated policy rates and slowing industrial activity. This reflected strong demand for yield in a low-volatility environment, as investors sought to maximize income without materially increasing duration risk. The combination of high coupons and limited default expectations supported sustained inflows into corporate bond funds and credit-focused strategies.
Carry-driven positioning further reinforced spread stability. With policy rates remaining elevated, holding corporate bonds generated substantial income even in the absence of price appreciation. Investors increasingly favored strategies that emphasized yield harvesting rather than directional credit bets. This reduced sensitivity to short-term economic data and limited the impact of weaker manufacturing or trade indicators on pricing. As long as earnings and cash flows remained sufficient to service debt, spreads faced little pressure to widen.
Private Credit Expansion and Lending Substitution
Private credit markets continued to expand in January, reinforcing the resilience of corporate financing conditions. As traditional banks maintained conservative lending standards, non-bank lenders filled the gap by providing direct loans to middle-market and leveraged borrowers. Fundraising activity in private credit remained strong, reflecting investor demand for floating-rate exposure and higher yields relative to public markets.
This expansion altered the transmission of monetary policy and credit risk. Greater reliance on private lenders reduced firms’ dependence on public bond markets and limited the immediate impact of spread movements on financing availability. However, it also increased opacity and reduced transparency around borrower leverage and covenant quality. While private credit supported near-term stability, it also concentrated risk in less regulated segments of the financial system, raising questions about longer-term resilience in the event of a sharper downturn.
Delayed Repricing of Default Risk
Despite slowing growth indicators, default risk remained largely unpriced in January. Corporate balance sheets benefited from prior refinancing at lower rates, extending debt maturities and reducing near-term rollover pressure. Interest coverage ratios remained adequate for most large issuers, supported by stable revenue streams and cost discipline. Rating agency outlooks and consensus forecasts continued to project only modest increases in default rates.
This delayed repricing reflected both structural and cyclical factors. Improved risk management practices, longer maturity profiles, and diversified funding sources enhanced corporate resilience. At the same time, investor optimism and abundant liquidity reduced incentives to stress-test downside scenarios aggressively. As a result, credit markets appeared to be pricing a soft-landing outcome rather than a material economic contraction. While this proved supportive in the short term, it increased vulnerability to adverse shocks that could force rapid reassessment of risk.
Implications
Taken together, January’s credit dynamics suggested that financial markets remained confident in corporate sector stability despite weakening growth signals. Tight spreads, strong carry demand, and expanding private credit supported resilient financing conditions. For investors, this environment favored income-oriented and high-quality credit exposure. However, the limited pricing of downside risk also implied asymmetric vulnerability. If economic conditions deteriorated more sharply than expected, credit markets could face abrupt repricing as delayed risks materialized.
-
US Investment Grade OAS (FRED)
https://fred.stlouisfed.org/series/BAMLC0A0CM
US High Yield OAS (FRED)
https://fred.stlouisfed.org/series/BAMLH0A0HYM2
Corporate Bond Yields (FRED)
https://fred.stlouisfed.org/series/BAA10Y
Moody's Default Rate Data
https://www.moodys.com/researchandratings/market-segment/corporate/credit-risk
S&P Global Default Statistics
https://www.spglobal.com/ratings/en/research-insights/special-reports/default-transition
Private Credit Market Data (Preqin)
https://www.preqin.com/insights
US Commercial Bank Lending Standards (FRED)
What to Watch For Next Month
Looking ahead to February 2026, market direction is likely to remain shaped by the interaction between interest rates, growth momentum, and investor risk tolerance. While inflation has moderated across most major economies, long term yields remain elevated, and financial conditions remain restrictive. As a result, markets will continue to focus on whether easing policy signals translate into improved financing conditions or remain constrained by structural pressures.
A key area to monitor will be upcoming inflation and labor market data in the United States and Canada. Any renewed acceleration in wage growth or services inflation could reinforce expectations that policy easing will remain gradual. Conversely, evidence of cooling employment conditions could strengthen expectations for faster rate cuts and reduce upward pressure on long term yields. The response of bond markets to these data releases will be critical in determining whether duration risk continues to dominate asset pricing.
Corporate earnings will also remain a central focus. As reporting season continues, investors will assess whether profit margins and revenue growth can be sustained in a slowing economic environment. Particular attention will be paid to large-cap technology firms, whose performance has disproportionately influenced index-level returns. Any deterioration in earnings visibility among market leaders could trigger broader risk repricing given current concentration levels.
Developments in China and Europe will remain important for global growth expectations. Further policy support in China, shifts in European fiscal policy, or changes in industrial activity could influence commodity demand and international capital flows. In addition, geopolitical developments affecting energy markets and trade relationships could reintroduce volatility into an otherwise range-bound environment.
Finally, credit markets warrant close monitoring. With spreads remaining tight despite slowing growth indicators, any increase in default activity, refinancing stress, or deterioration in corporate balance sheets could prompt a reassessment of risk pricing. February’s data and earnings releases will therefore be critical in determining whether credit resilience remains justified or begins to weaken.
Closing Remarks
January 2026 reflected a market environment defined by structural constraints rather than short-term cyclical shifts. Long term interest rates remained elevated despite easing policy signals, reinforcing pressure on valuation-sensitive assets and limiting the scope for broad-based risk-taking. At the same time, equity performance remained concentrated in U.S. large-cap leaders, while credit markets continued to price stability in the face of slowing growth indicators.
These dynamics highlighted a growing reliance on perceived quality, liquidity, and earnings reliability. Investors increasingly favored assets and regions with strong balance sheets and predictable cash flows, while remaining cautious toward cyclical and financing-dependent sectors. This preference reinforced narrow leadership patterns and reduced diversification benefits across portfolios.
Looking ahead, market performance will depend on whether structural pressures on yields and global growth begin to ease. A sustained decline in long term rates, broader earnings participation, and continued labor market resilience would support more balanced asset performance. In contrast, prolonged manufacturing weakness or a deterioration in credit conditions could expose vulnerabilities created by concentrated positioning and delayed risk repricing.
Overall, January’s developments suggest that markets have entered a phase characterized by moderate growth, elevated financing costs, and selective risk-taking. In this environment, disciplined portfolio construction, careful duration management, and attention to balance sheet strength remain essential. Until clearer signals of structural improvement emerge, investors are likely to continue prioritizing resilience over aggressive return seeking.